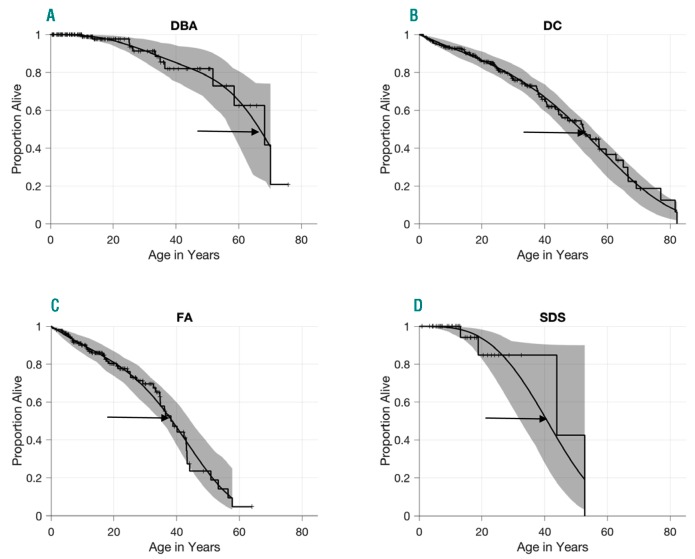
Figure 3.
Survival curves for patients in the NCI IBMFS cohort, showing proportion alive by age in years. (A) Diamond-Blackfan anemia (DBA), (B) Dyskeratosis congenita (DC), (C) Fanconi anemia (FA) and (D) Shwachman-Diamond syndrome (SDS). Tick marks represent patients who were still alive at the time of analysis. Observed survival (stair-step lines) and smoothed survival (smooth curves) are shown; shaded areas show 95% confidence intervals for the smoothed curves.

