Figure 1.
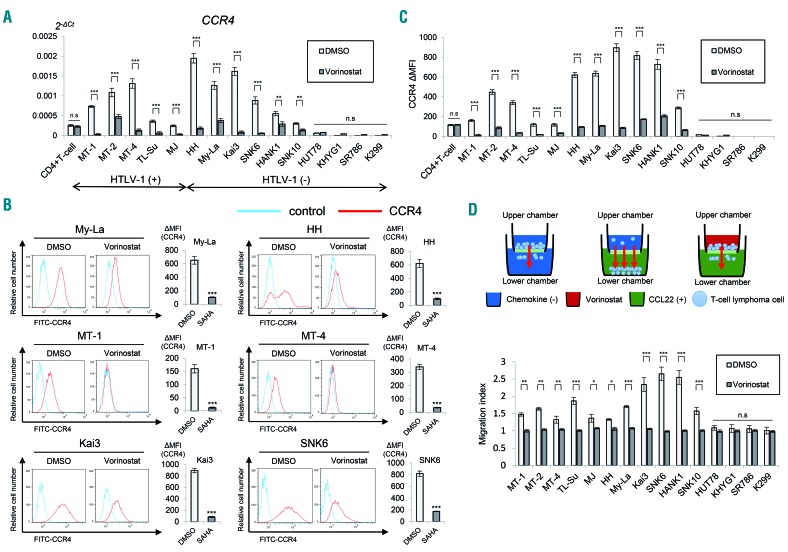
The pan-histone deacetylase inhibitor, vorinostat reduces CCR4 expression in various T-cell and natural killer-cell lymphoma cell lines. Bars indicate the mean ± standard error of the mean (SEM) of three independent experiments. Asterisks (*) indicate statistical significance: *0.01 ≤ P < 0.05, **0.001 ≤ P < 0.01, ***P < 0.001, n.s: not siginificant. (A) Quantitative RT-PCR analysis of CCR4 in vorinostat-treated T- and NK-cell lymphoma cell lines (5 μM for 24 h). The Student t-test was used to examine statistical significance. x-axis: cell lines. y-axis: 2−ΔCt values for microRNA expression. (B) Flow cytometry analysis of CCR4 in indicated T- and NK-cell lymphoma cells treated with vorinostat. Cells were stained with CCR4-FITC 24 h after vorinostat treatment (5 μM). Representative flow cytometry histograms are shown. ΔMFI (mean fluorescence intensity) values were obtained after subtraction of the isotype control, MFI from CCR4 MFI. SAHA: suberoylanilide hydroxamic acid. (C) ΔMFI of CCR4 in vorinostat-treated T- and NK-cell lymphoma cell lines (5 μM for 24 h). x-axis: cell lines. y-axis: ΔMFI of CCR4 in dimethylsulfoxide (DMSO) or vorinostat-treated T- and NK-cell lymphoma cell lines. (D) Migration assay of lymphoma cells treated with 5 μM vorinostat for 24 h. A schematic illustration of the migration assay is also shown. RFU: relative fluorescence units.

