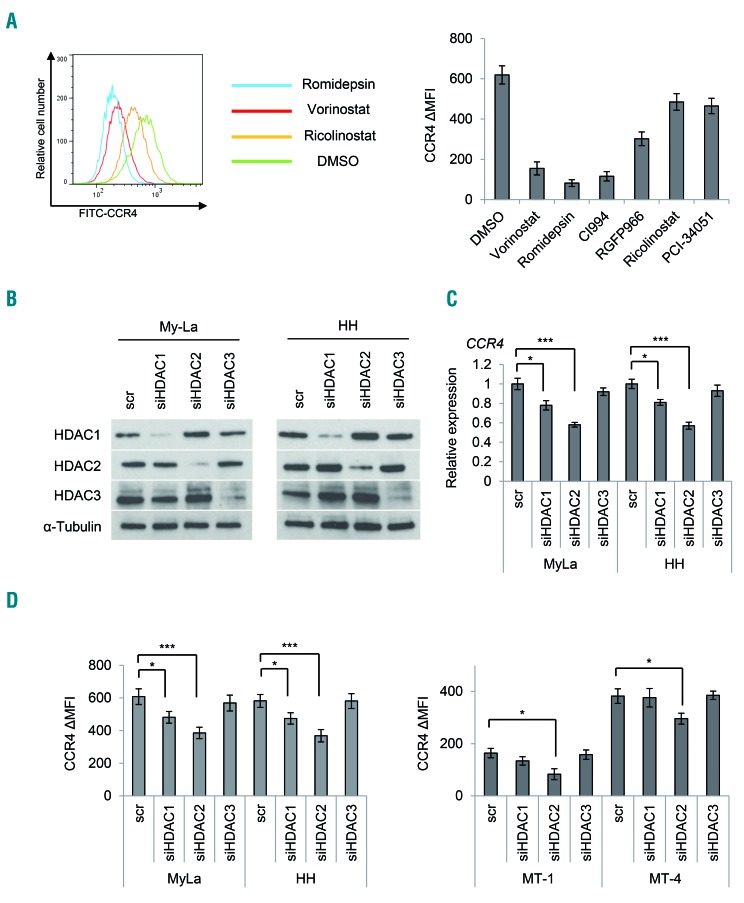
Figure 2.
Effect of isoform-specific histone deacetylase inhibitors and histone deacetylase knockdown on CCR4 expression. Bars indicate the mean ± standard error of the mean (SEM) of three independent experiments. Asterisks (*) indicate statistical significance: *0.01 ≤ P < 0.05, ***P < 0.001. (A) Flow cytometry analysis of CCR4 in CTCL cells (My-La) treated with various HDAC inhibitors. Cells were stained with CCR4-FITC 24 h after treatment (5 μM vorinostat, 10 nM romidepsin, 50 μM CI994, 20 μM RGFP966, 10 μM ricolinostat, and 75 μM PCI-34051). Left panel: representative flow cytometry histograms are shown. Right panel: ΔMFI of CCR4 in My-La cells treated with HDAC inhibitors. (B) Transient knockdown of HDAC (HDAC1, HDAC2, and HDAC3) in CTCL (My-La and HH) cells. Western blot analysis of HDAC1, HDAC2, and HDAC3 in cells after transient transduction of siHDAC or a scrambled control (scr). Tubulin: protein positive control. (C) Quantitative RT-PCR analysis of CCR4 after transient transfection of siHDAC and a scr in CTCL cells. x-axis: cell lines; y-axis: expression relative to control cells that were assigned a value of 1.0. (D) ΔMFI of CCR4 after transient transfection of siHDAC and scr in CTCL (My-La and HH) and ATLL (MT-1 and MT- 4) cells. x-axis: cell lines; y-axis: ΔMFI of CCR4. MFI: mean fluorescence intensity.

