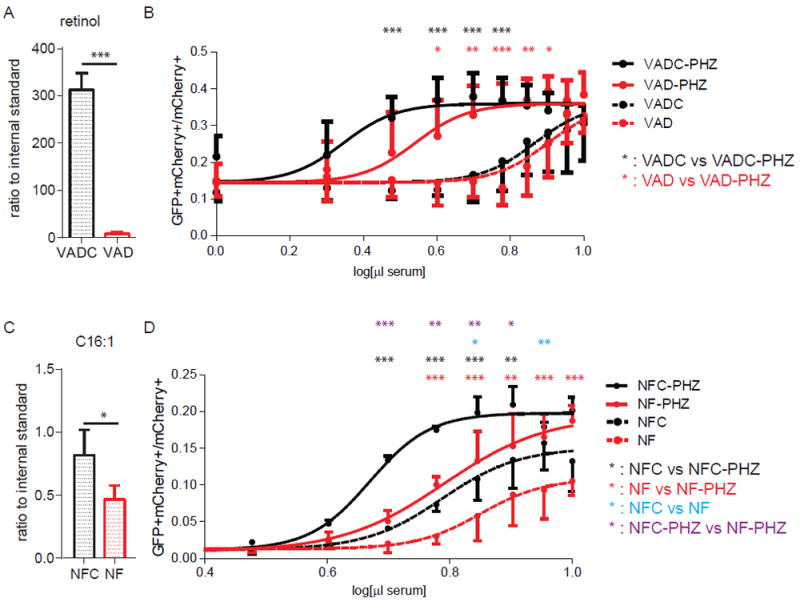
Figure 5. Effect of vitamin A deficiency (VAD) and fatty acid deficiency (NF) on plasma RXRA ligands.

(A) Plasma concentration of retinol in VAD mice and control mice by mass spectrometry. Control mice, N = 5; VAD mice, N = 5. (B) UAS-GFP bone marrow Kit+ cells were transduced with Gal4-RXRA retrovirus and treated with plasma from VAD mice and control mice which were treated with or without PHZ. VAD: plasma from vitamin A deficient mice. VADC: plasma from mice treated with a control diet. VAD mice, N = 4; VAD + PHZ mice, N = 4; VADC mice, N = 5; VADC + PHZ mice, N = 5. (C) Plasma concentration of the fatty acid C16:1 in NF mice and control mice determined by mass spectrometry. NF mice, N = 5; NFC mice, N = 4. (D) The concentration of RXR ligands in fatty acid deficient mice was determined by treating reporter cells as in (B). NF: plasma obtained from mice treated with a fatty acid deficient diet. NFC: plasma from mice treated with a fatty acid control diet. NFC mice, N = 3; NFC + PHZ mice, N = 2; NF mice, N = 3; NF + PHZ mice, n = 4. Error bars represent standard deviation between measurements of plasma obtained from separate mice. * P < 0.05, ** P < 0.01, *** P < 0.001, ANOVA with Tukey’s multiple comparisons compared results obtained at each plasma concentration.
