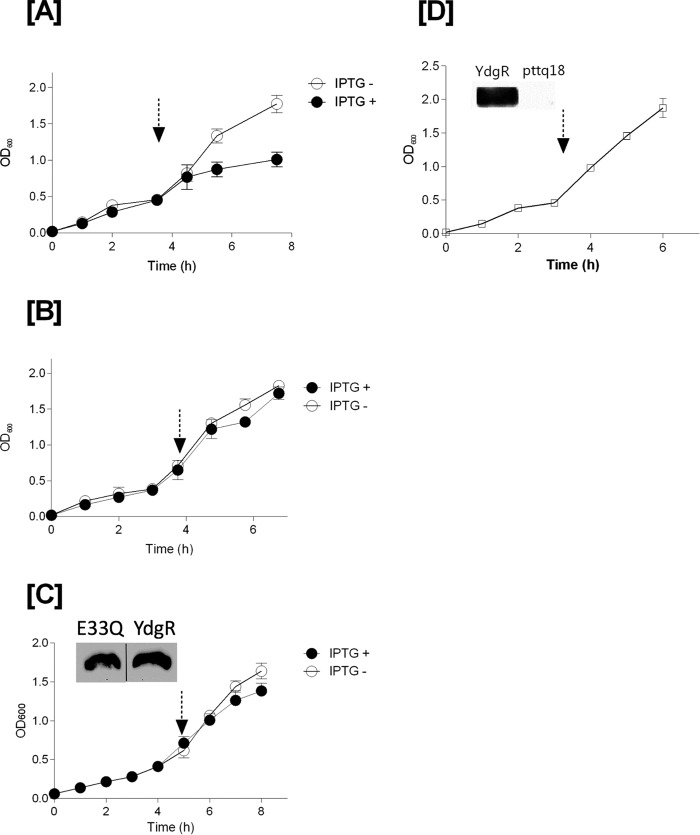
Figure 2.
Growth curves of YdgR, pTTQ18 vector, and YdgR–E33Q mutant in BL21(DE3)pLysS cells (in the presence of 100 μg/ml of ampicillin and 34 μg/ml of chloramphenicol). Arrow marks indicates time of induction with IPTG. Closed symbols for the cells induced with IPTG and open symbols for cells without IPTG. A, YdgR; B, pTTQ18 vector; and C, YdgR–E33Q (the insert of Western blot bands are spliced from the same gel). Open squares indicate the growth of BL21(DE3) cells in the presence of 100 μg/ml of ampicillin and absence of 34 μg/ml of chloramphenicol. D, YdgR; n = 3.

