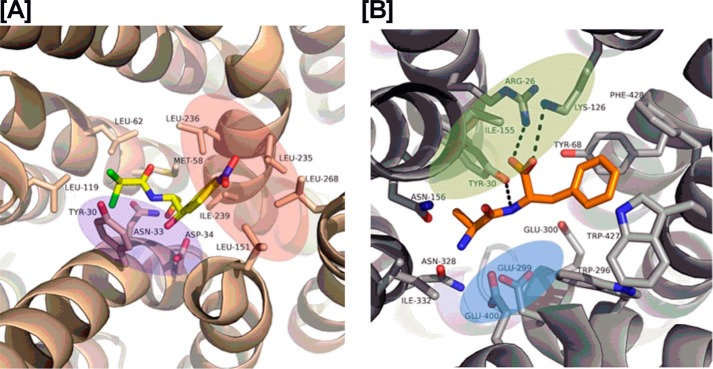
Figure 8.
The red, blue, and green color patches represent the hydrophobic, hydrophilic, and protonation sites, respectively. A, interactions between Cam (yellow color) and MdfA (wheat color) in a crystal structure (PDB code 4ZOW). B, interactions between the Ala–Phe peptide (yellow color) and PepTSt (gray color) in the crystal structure (PDB code 5D59).

