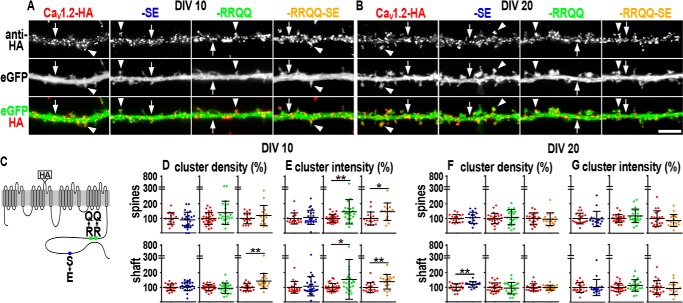
Figure 2.
Distribution and size of clusters of membrane-expressed phosphomimetic CaV1.2-HA constructs. A and B, dendritic segments of neurons transfected with CaV1.2-HA, CaV1.2-HA-SE, CaV1.2-HA-RRQQ, or CaV1.2-HA-RRQQ-SE and immunolabeled with anti-HA antibody at DIV 10 (A) and DIV 20 (B) in non-permeabilized conditions. Co-expressed soluble eGFP outlines the morphology of the dendrites. All channel mutants distribute in clusters along the dendritic shafts (arrows) and on the spines (arrowheads) similar to the control CaV1.2-HA. Scale bar, 5 μm. C, topology of CaV1.2-HA indicating the position of the extracellular HA tag, the S1928E exchange (SE, blue circle), and the double substitution R1696Q,R1697Q (RRQQ, green circle), which prevents the inhibitory interaction within the C terminus (15). Yellow represents the CaV1.2-HA carrying the RRQQ and SE mutations (CaV1.2-HA-RRQQ-SE). D and F, quantification of density (number of clusters per spine or per surface unit of dendritic shaft) and the intensity (average gray values). E and G, CaV1.2-HA-SE, CaV1.2-HA-RRQQ, and CaV1.2-HA-RRQQ-SE expressed as percentage of control CaV1.2-HA. Cluster density increased along the shaft at DIV 10 for CaV1.2-HA-RRQQ-SE (D, yellow scatter plot, p = 0.002) and at DIV20 for CaV1.2-HA-SE (F, blue scatter plot, p = 0.008). Cluster fluorescence intensity augmented on the spines and along the dendritic shafts of young neurons expressing CaV1.2-HA-RRQQ (E, green scatter plot, p = 0.004 and p = 0.017, respectively) and CaV1.2-HA-RRQQ-SE (E, yellow scatter plot, p = 0.018 and p = 0.009, respectively). Statistics: Mann-Whitney rank sum test. Analyzed dendritic segments in at least three separate experiments: DIV 10, NCaV1.2-HA = 18–19 and NCaV1.2-HA-SE = 24–26, NCaV1.2-HA = 30 and NCaV1.2-HA-RRQQ = 23, NCaV1.2-HA = 18–19 and NCaV1.2-HA-RRQQ-SE = 15–18; DIV 20, NCaV1.2-HA = 19 and NCaV1.2-HA-SE = 17, NCaV1.2-HA = 26 and NCaV1.2-HA-RRQQ = 23, NCaV1.2-HA = 21–22 and NCaV1.2-HA-RRQQ-SE = 18–20. Scatter plots: mean ± S.D. **, 0.002 < p < 0.009 and *, 0.017 < p < 0.018.

