
Figure 6.
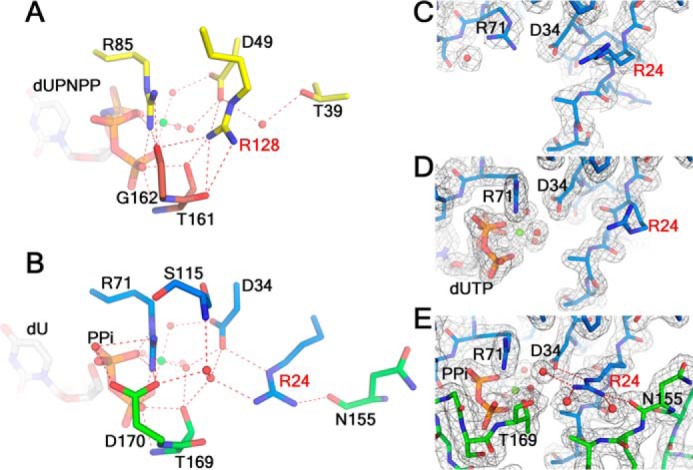
Residues in the second-shell region of the active site are reconfigured in wDUT. A, the second-shell region around the conserved Arg128 in hDUT. B, the second-shell region around Arg24 in wDUT, in an aligned view of A. C–E, the conformations of Arg24 in the free wDUT (C), wDUTD88N/R158E-dUTP-Mg2+ (D), and wDUT-dU-PPi-Mg2+ (E), shown in aligned views. The σA-weighted 2Fo − Fc electron density maps (contoured at 1σ level) are shown as gray mesh. For all panels, hydrogen bonds are shown as red dotted lines. Residues are in subunit-based colors. Ligands are shown as sticks.