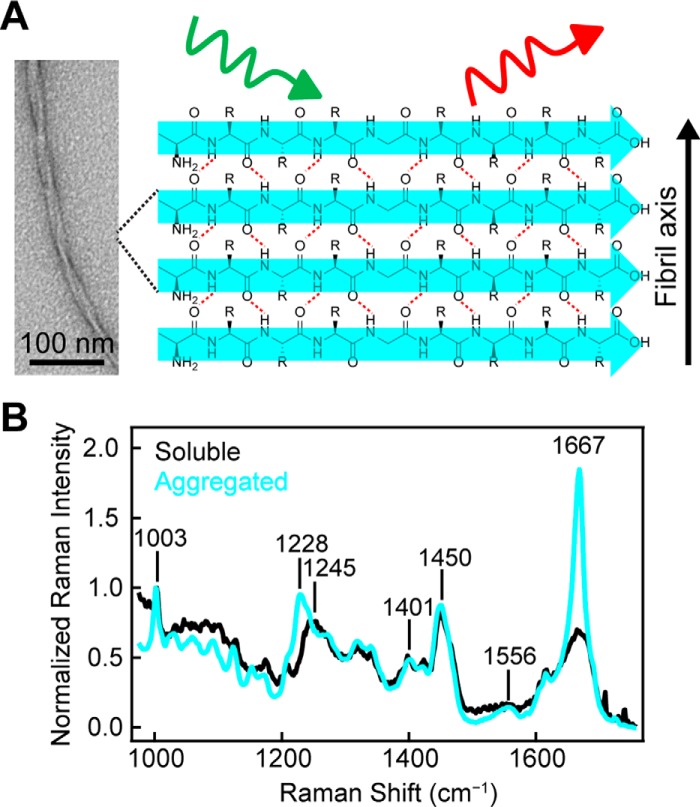
Figure 1.
α-Synuclein amyloid formation probed by Raman spectroscopy. A, representative schematic of Raman excitation of parallel in-register amyloid structure adopted by α-syn. Hydrogen bonds are indicated by red dashed lines. Scale bar, 100 nm. B, comparison of Raman spectra of WT-α-syn (500 μm) before (black) and after (cyan) 4 h incubation at 37 °C in pH 5 buffer (10 mm NaOAc, 100 mm NaCl). The spectra were collected at room temperature and normalized to Phe band at 1003 cm−1.

