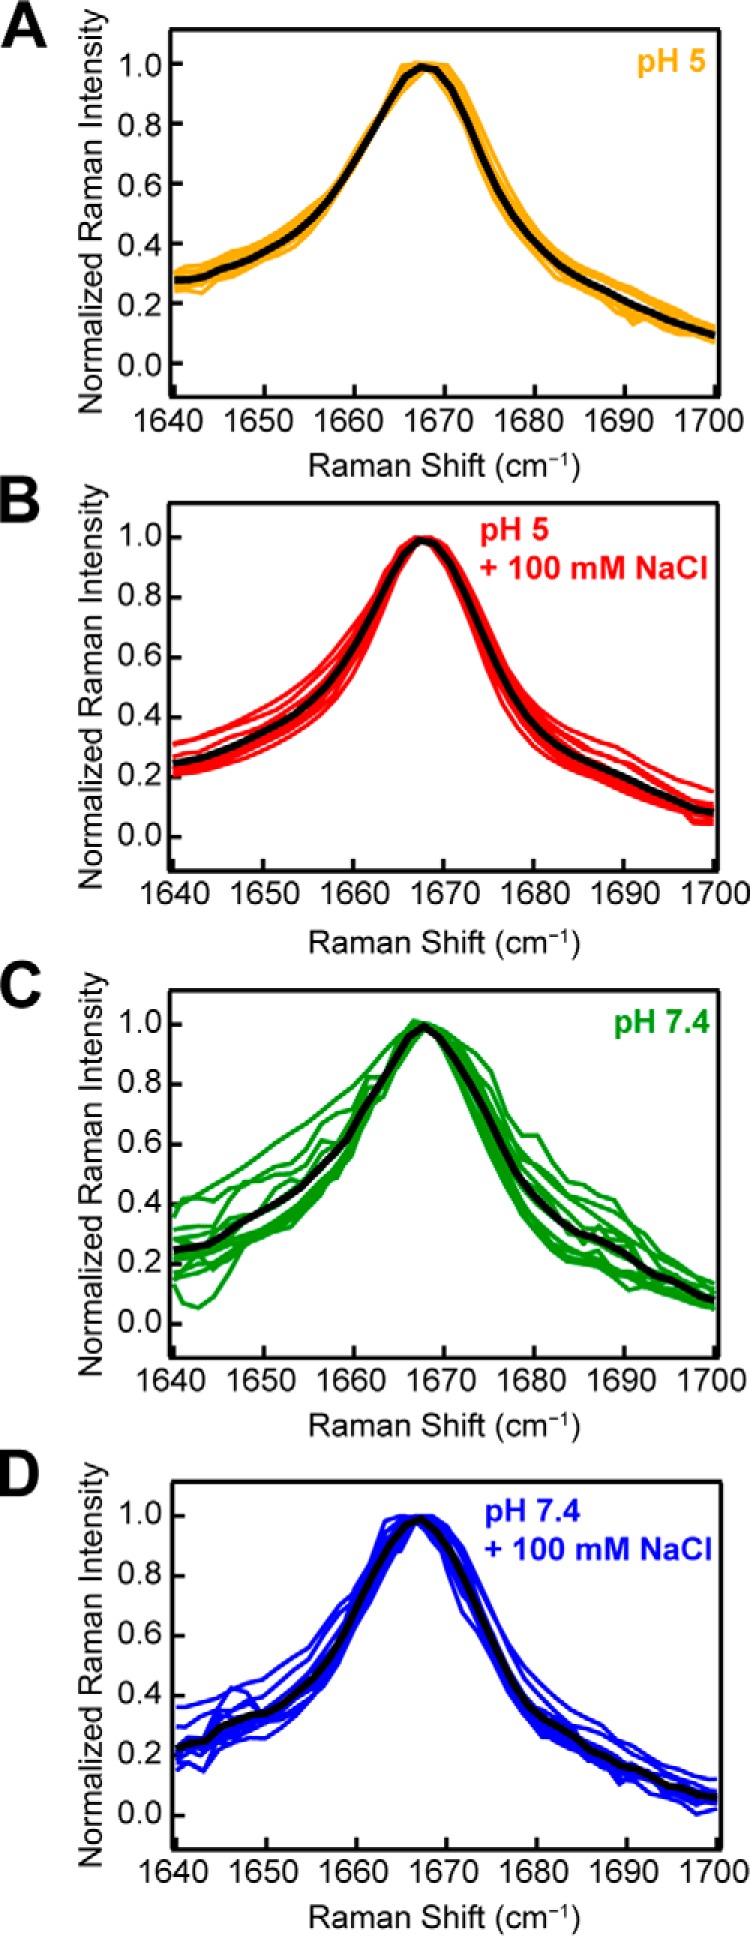
Figure 5.

Consistency and reproducibility of amide-I peak for WT-α-syn. Samples were aggregated at several protein concentrations in a variety of aggregation vessels at pH 5 in the absence (A, n = 10) and presence (B, n = 11) of 100 mm NaCl and at pH 7.4 in the absence (C, n = 12) and presence (D, n = 13) of 100 mm NaCl. Individual spectra are plotted as colored curves, with mean curve of the distribution plotted in black. The data are normalized to the amide-I peak at 1667 cm−1.
