Figure 2.
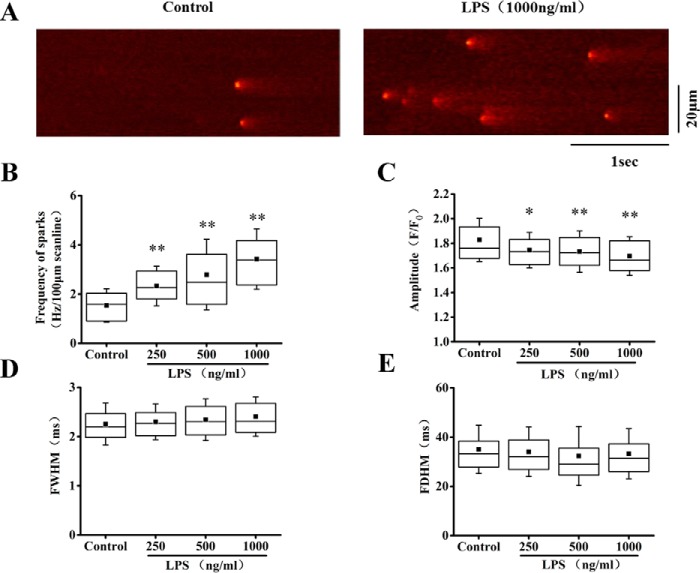
LPS increased Ca2+ sparks in cardiomyocytes. A, representative Ca2+ spark images in control and LPS (1000 ng/ml)-treated cells. B, average of the frequency of Ca2+ sparks in control and 250–1000 ng/ml LPS-treated cells. C–E, statistics of the amplitude (F/F0; C), full width of half-maximum (FWHM; D), and full duration at half-maximum (FDHM; E) of Ca2+ sparks in control and LPS groups (n = 53–75 cells/group). *, p < 0.05; **, p < 0.01 versus control. Error bars, S.D.

