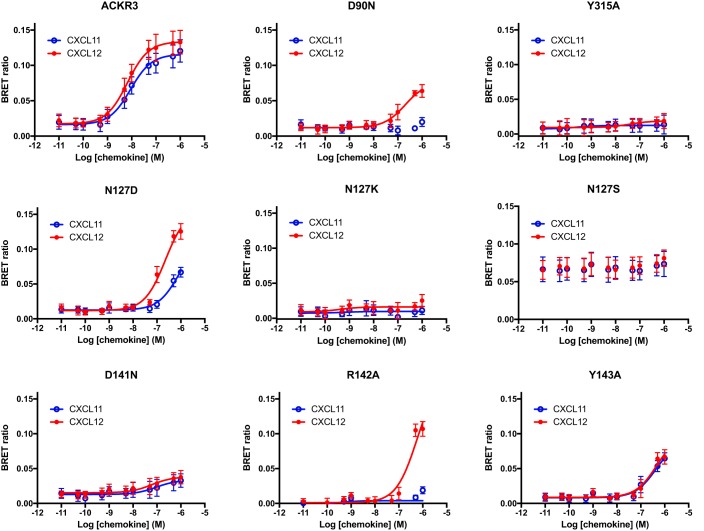
Figure 2.
Arrestin recruitment to ACKR3 mutants. Shown are dose-response curves of arrestin recruitment to wildtype ACKR3 (top left) or the indicated mutants after CXCL12 (red lines and symbols) or CXCL11 (blue lines and symbols) challenge. The maximal ligand concentration used was 1 μm. Values are means from at least three independent experiments conducted in duplicate. Error bars, S.D.

