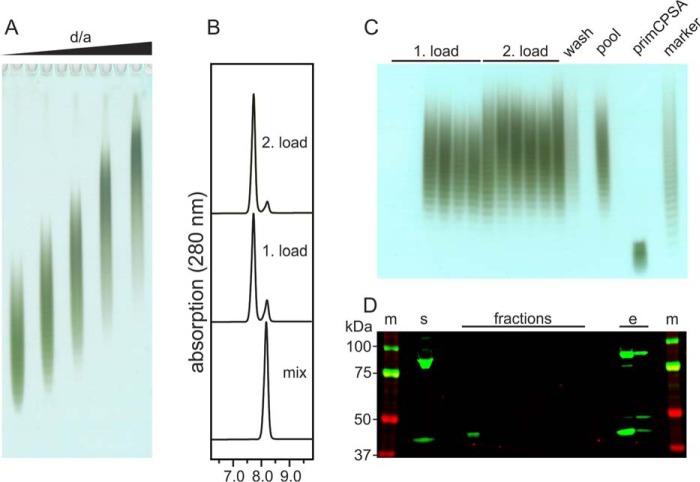
Figure 7.
Solid-phase synthesis of CPSA oligosaccharides. A, Alcian blue/silver-stained PAGE of CPSA generated in CsaB–CsaA reactions at varying d/a ratios. B, HPLC-AEC chromatograms documenting the reaction progress by detecting UDP-GlcNAc (right peak) and UMP (left peak) in the reaction mix before loading and in a representative fraction after the first and the second load. C, Alcian blue/silver-stained PAGE of all collected fractions for visualization of CPSA. D, Western blot analysis demonstrating stable attachment of CsaB–CsaA to the column matrix until elution performed with imidazole. Lanes m, marker; lane s, soluble fraction of E. coli lysate used to prepare the enzyme loaded column; lane e, protein eluted with imidazole after the reaction.

