
Figure 9.
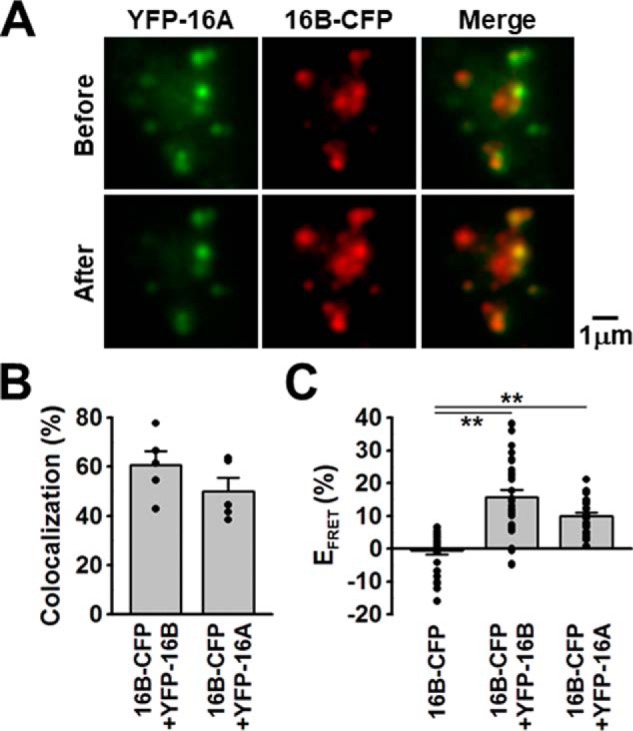
Single-molecule imaging of TMEM16A and TMEM16B. A, YFP-TMEM16A (acceptor) and TMEM16B-CFP (donor) were transiently co-transfected into HEK293 cells. Single-molecule images were obtained by TIRF microscopy. Note that CFP fluorescent signals were enhanced after YFP photobleaching. B, co-localization rate of CFP and YFP fluorescent signals in TMEM16B-CFP/YFP-TMEM16B or TMEM16B-CFP/YFP-TMEM16A HEK293 cells (n = 5 cells). C, EFRET of TMEM16B-CFP alone (as a negative control), TMEM16B-CFP/YFP-TMEM16B (as a positive control), or TMEM16B-CFP/YFP-TMEM16A HEK293 cells (n = 26∼29 particles from 5 cells). **, p < 0.01 by Tukey's test.