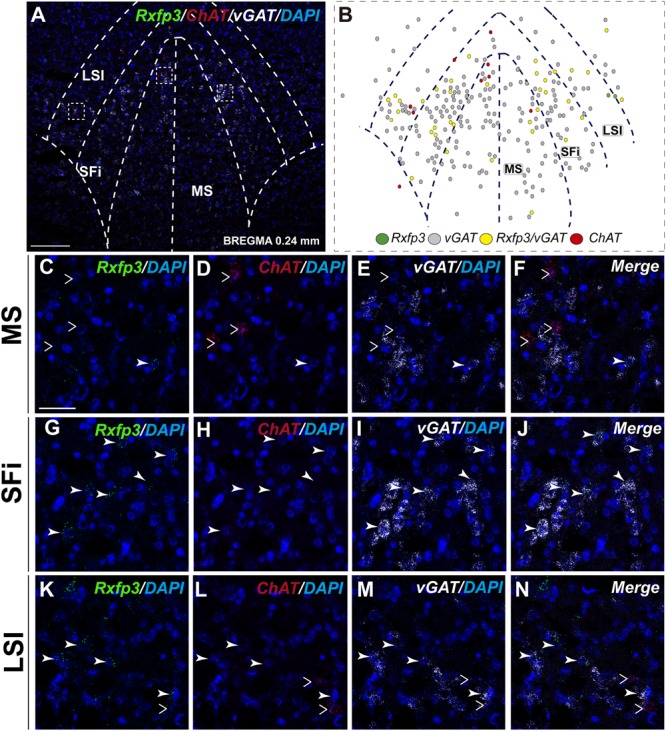
FIGURE 5.

Distribution of neurons expressing Rxfp3, vGAT (slc32a1), and ChAT mRNA, relative to DAPI-stained nuclei in the rat MS, SFi, and LSI at bregma +0.24 mm (A) and a schematic map illustrating different neuronal phenotypes based on mRNA co-expression, and their distribution (B). Dotted lines indicate the midline and the medial and lateral septal and septofimbrial borders. High-magnification images illustrate co-localization of Rxfp3 (C,G,K), ChAT (D,H,L), vGAT (E,I,M) mRNA and merged signals (F,J,N) in the MS, SFi, and LSI, respectively. No co-localization of Rxfp3 and ChAT mRNA was observed (open arrowheads). Calibration bar in (A) 125 μm and (C–N) 50 μm.
