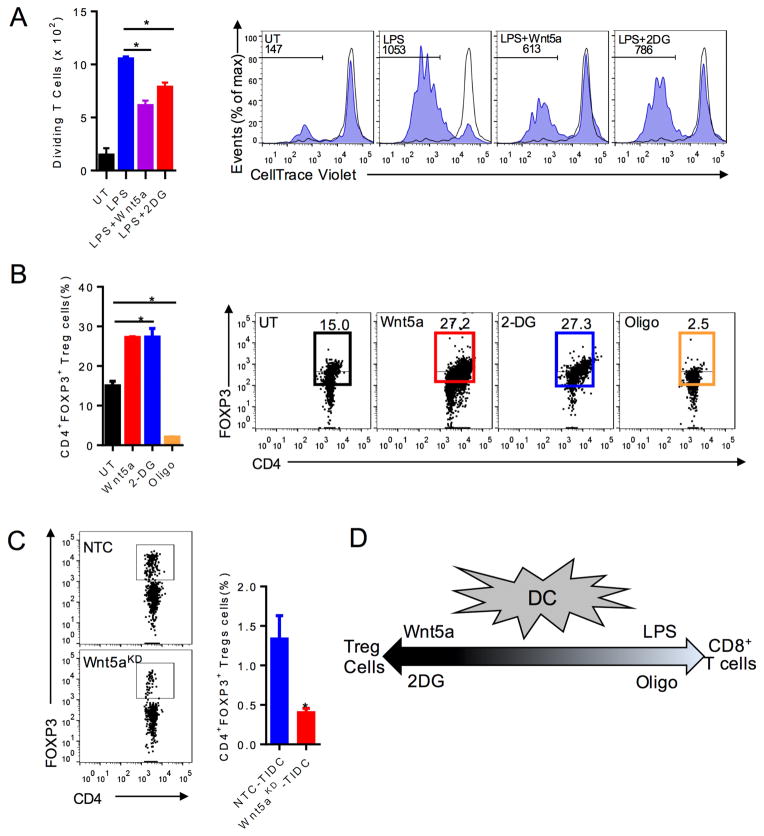
Figure 2. DC Function is Regulated by Cellular Metabolism.
A. T cell proliferation assay: DCs loaded with OVA257-264 peptide, pre-treated with rWnt5a or 2DG, stimulated with LPS, and co-incubated with OT-I splenocytes. CD3+CD8+ T cell proliferation measured by CellTrace Violet (CTV) dilution. n=3. right, Representative flow cytometry CTV dilution assay based on 3 independent experiments. Gated on CD3+CD8+ T cells. B. DCs treated with Wnt5a, 2-DG, or Oligo prior to in vitro Treg cell assay measuring DC-induced CD4+FoxP3+ Treg cells. n=3. right, Representative flow cytometry plot of Treg cell analysis based on 3 independent experiments. C. Treg cell analysis of inguinal lymph nodes by flow cytometry. left, Representative of 3 independent experiments. 4 mice/group. D. Schematic illustrating the dynamic spectrum of DC-induced T cell responses based on their metabolic alteration. UT untreated. KD, knockdown. All data are mean +/− SEM. *P<0.05. See also Figure S2.

