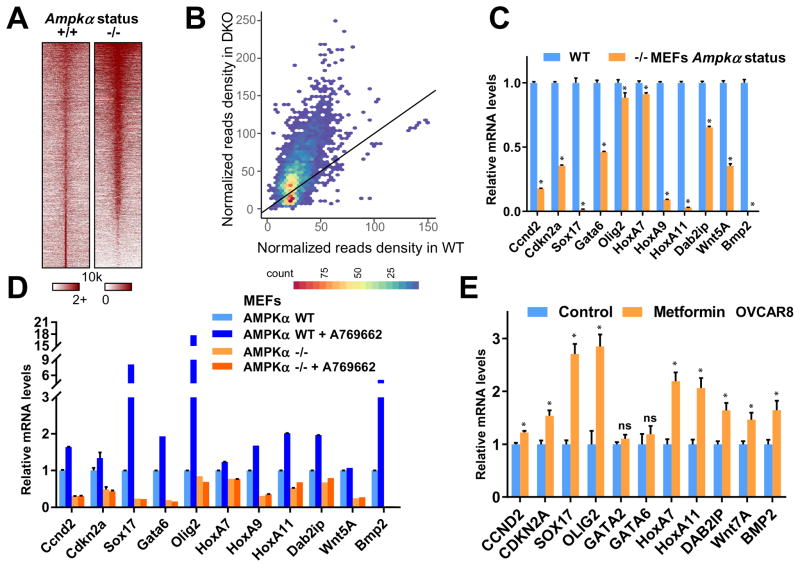
Figure 2. AMPK Abrogates EZH2-mediated Epigenetic Silencing of PRC2 Target Genes.
(A) Heat map depicting the H3K27me3 ChIP-Seq signal ±10 kb around its peak summit in both Ampkα WT and DKO MEFs.
(B) Scatter density plot comparing H3K27me3 signals in Ampkα wild type (WT, x-axis) and double knockout (KO, y-axis) MEF cells. Read counts within a 5 kb window around the center of each H3K27me3 peak, which was pooled from both cell conditions, were normalized by 10 million total reads. The color scale indicates the density of peaks.
(C) Ampkα WT and DKO MEFs were subjected to quantitative real-time RT-PCR analyses for relative RNA levels of the indicated genes. Expression levels of these genes were normalized and compared to those of Ampkα WT. Data are means ± SD (n = 3), * P < 0.05, Student’s t test.
(D) Ampkα WT and DKO MEFs were treated with 100 μM A769662 as indicated for 48 hours. Total RNAs were extracted for quantitative real-time RT-PCR analyses for relative RNA levels of the indicated genes. Expression levels of these genes were normalized and compared to those of Ampkα WT without treatment.
(E) Control and 2 mM metformin-treated OVCAR8 cells were subjected to quantitative real-time RT-PCR analyses for relative RNA levels of the indicated genes. Expression levels of these genes were normalized and compared to those of the untreated control cells. Data are means ± SD (n = 3), * P < 0.05; ns, not significant, Student’s t test.
See also Figure S2.

