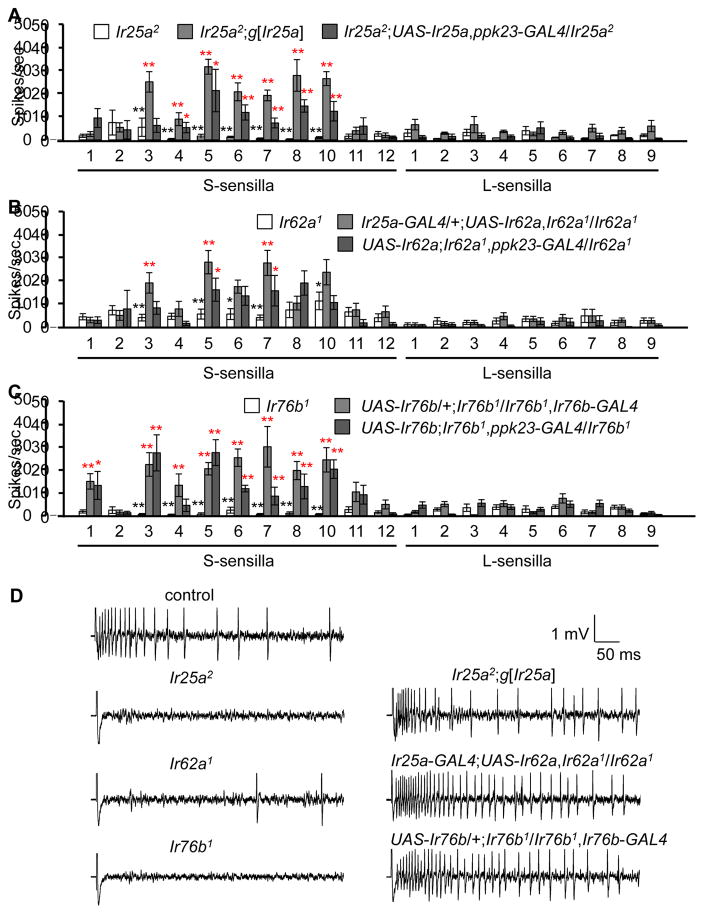
Figure 3. Dependence on Ir25a, Ir62a, and Ir76b for Ca2+-induced action potentials.
Tip recordings were performed in response to 50 mM CaCl2.
(A—C) Mean responses of sensilla from Ir25a2, Ir62a1 or Ir76b1, or the mutants expressing the genomic rescue transgene (g[Ir25a]) or a UAS-cDNA rescue transgene under control of the indicated GAL4s. n=10—26.
(D) Representative traces showing Ca2+-induced action potentials.
Error bars represent SEMs. The black and red asterisks indicate significant differences from the controls and the mutants, respectively (**P<0.01, *P<0.05), using single factor ANOVA with Scheffe’s post hoc test to compare two sets of data.

