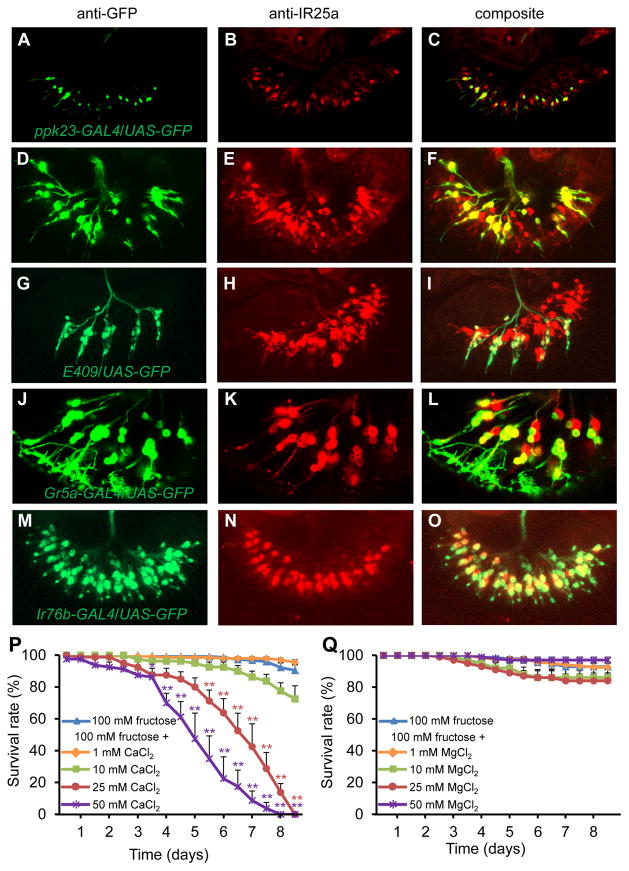
Figure 4. Labellar expression of IR25a, and toxicity of high Ca2+.
(A—O) Staining of labella from controls viewed by confocal microscopy. 3-D reconstructions generated by maximum transparency. Scale bars represent 25 μm.
(A, D, G, J, M) UAS-GFP expression driven by the indicated GAL4s. The signals were detected by anti-GFP staining (green).
(B, E, H, K, N) Anti-IR25a staining (red).
(C, F, I, L, O) Merged images of anti-GFP and anti-IR25 staining.
(P and Q) Survival of control flies fed 100 mM fructose or 100 mM fructose mixed with: (P) CaCl2, or (Q) MgCl2. n=4—7. Error bars represent SEMs. The asterisks indicate significant differences from the fructose only feeding (**P<0.01, *P<0.05.) using single factor ANOVA with Scheffe’s as a post hoc test to compare two sets of data.

