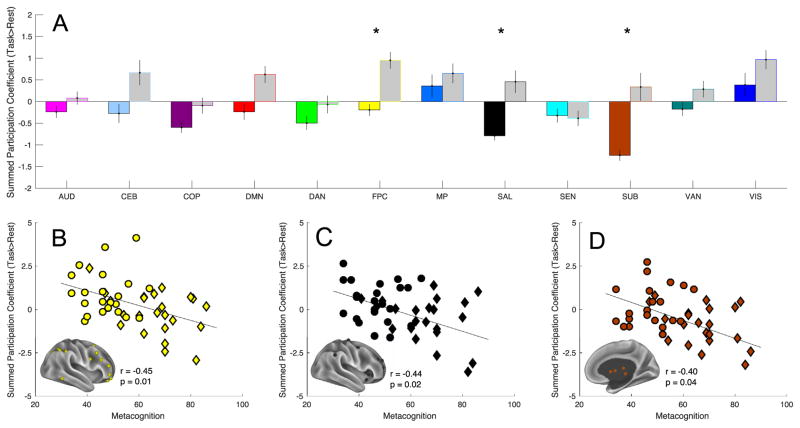
Figure 3.
Task-induced change in summed participation coefficient hubness of frontoparietal (yellow), salience (SAL) (black), subcortical (SUB) (brown) networks significantly differed between autism spectrum disorder children and typically developing children (A). *Denotes Bonferroni-Holm corrected. Gray-filled bars indicate the typically developing group, color-filled bars indicate the autism spectrum disorder group. Correlations between the change of these networks: panel (B) is frontoparietal control (FPC), panel (C) is salience, and panel (D) is subcortical—with Metacognition Index of the Behavior Rating Inventory of Executive Function. Autism spectrum disorder and typically developing subjects are plotted as diamonds and circles, respectively. AUD, auditory; CEB, cerebellar; COP, cingulo-opercular; DAN, dorsal attention network; DMN, default mode network; MP, medial parietal; SEN, sensorimotor; VAN, ventral attention network; VIS, visual.

