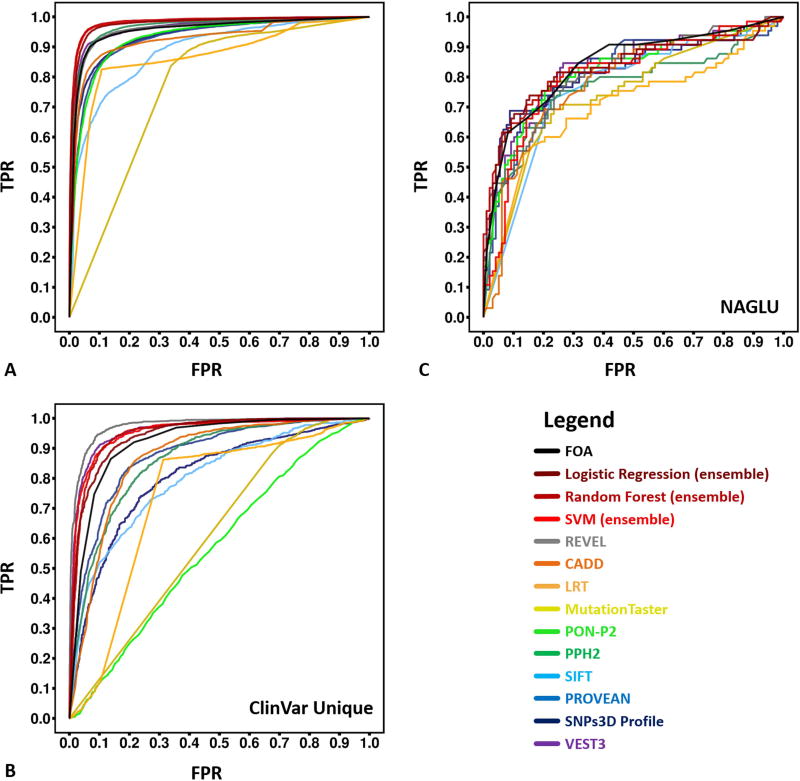
Figure 5.
ROC (receiver operating characteristic) curves for predictions of pathogenicity by the new ensemble methods and other methods on HGMD, ClinVar unique and NAGLU challenge sets. For NAGLU, the pathogenicity threshold is an activity of 0.3 of wild type. The AUC (area under curve) of these ROC curves are listed in Table 2
A) For HGMD test data, the new ensemble models (Logistic Regression 0.98, Random Forest 0.98 and SVM 0.97) outperformed all constituent individual predictors on the HGMD test dataset. PPH2 and VEST3, which were also trained partially or completely on HGMD, have slight but significantly (P-value < 2.2e-6) worse AUCs.
B) For the unique ClinVar dataset (no overlap with HGMD or OMIM), another ensemble method, REVEL, outperformed all other methods. The next highest AUCs, for VEST3 and our ensemble models, are slightly but significantly (P-value < 0.05) smaller.
C) For the NAGLU rare population variants, all methods perform substantially worse than on HGMD and ClinVar. Our ensemble FOA (fraction of agreement) method has the best AUC of 0.84, followed by our Logistic Regression and Random Forest models, and VEST3. All four are not significantly different from each other (P-values > 0.05).

