
Figure 5. Cells generate ΔRps26 ribosomes in response to high salt and high pH.
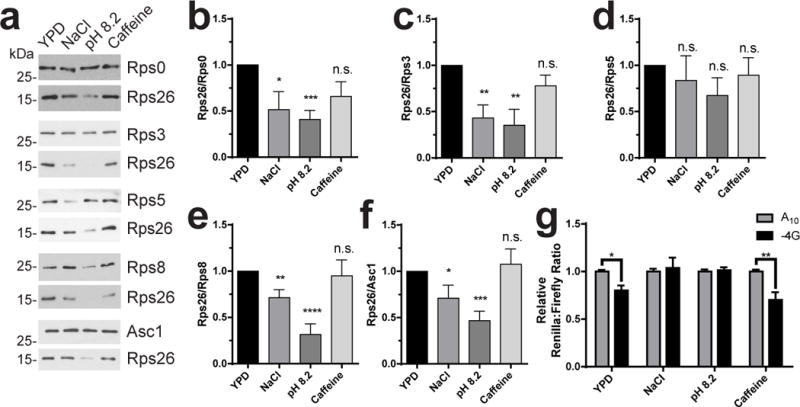
a, Levels of Rps0, Rps3, Rps5, Rps8, Rps26 and Asc1 in ribosomes purified from wild type yeast grown in YPD alone, or YPD with 1M NaCl, pH 8.2 or 10 mM caffeine were analyzed by western blotting. Because all ribosomal proteins but Rps26 are nearly identical in size, separate gels were run to analyze each of these proteins relative to Rps26, and the Rps26 and RpsX bands from each of these are shown. b-f, Quantification of data in panel A. Data were from ribosomes grown and purified in three or four (caffeine) independent replicates for each condition, each run on two different sets of gels and analyzed by t-test. For b: NaCl (*) p=0.0388 t=2.469 DF=8; pH (***) p=0.0003 t=5.967 DF=8; Caff. (ns) p=0.1018 t=1.802 DF=10. For c: NaCl (**) p=0.0025 t=4.015 df=10; pH (**) p=0.0036 t=3.773 DF=10; Caff. (ns) p=0.1343 t=1.606 DF=12. For d: NaCl (ns) p=0.5534 t=0.6132 DF=10; pH (ns) p=0.1184 t=1.708 DF=10; Caff. (ns) p=0.5866 t=0.5618 DF=10. For e: NaCl (**) p=0.008 t=3.299 DF=10; pH (****) p<0.0001 t=7.599 DF=8; Caff. (ns) p=0.8089 t=0.2472 DF=12. For f: NaCl (*) p=0.048 t=2.287 DF=9; pH (***) p=0.0004 t=5.132 DF=10; Caff. (ns) p=0.6934 t=0.4039 DF=12. Bars represent mean values, error bars = SEM. g, Luciferase assays of WT cells after a 4 hour exposure to different stress conditions. For YPD n=7, and for all others n=6, independently grown cultures. By two-way ANOVA: YPD (*) p=0.0219 t=2.817, NaCl (ns) p=0.8563 t=0.4983, pH (ns) p=0.8673 t=0.1681, and Caff. (**) p=0.0014 t=3.884 with DF=42. Bars represent mean values, error bars = SEM. Original blot images are in Supplementary Data Set 3.