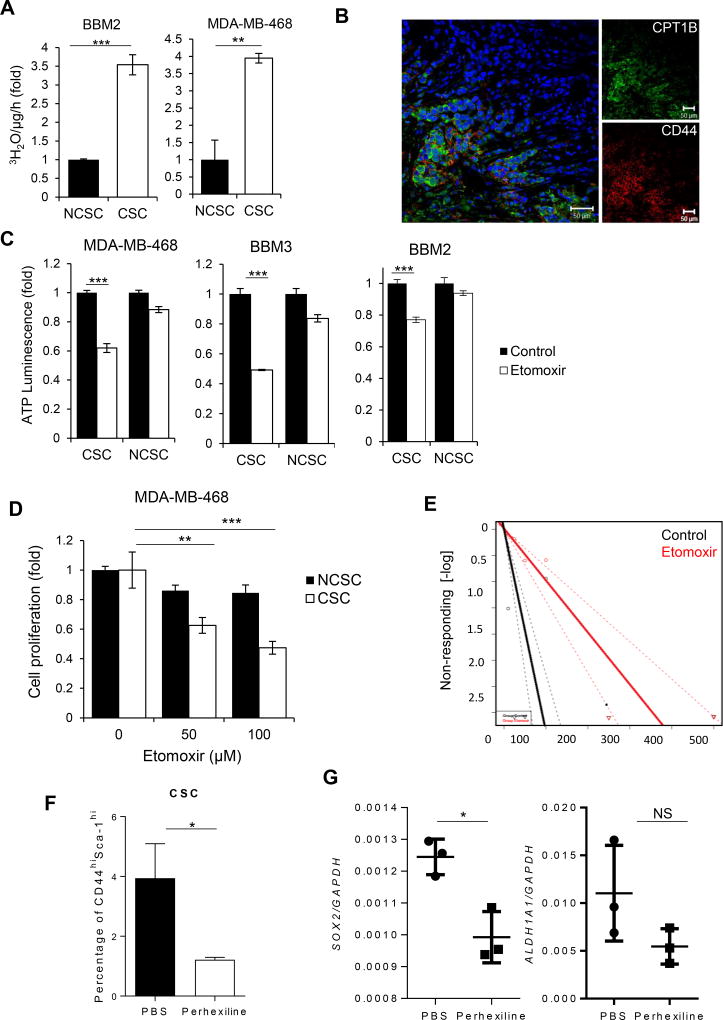
Figure 2. FAO is Elevated in BCSCS and Required for Self-Renewal.
(A) FAO assay comparing of FAO levels in BBM2 tumorspheres (CSC) vs. adherent BBM2 cells (NCSC) and CD44+/CD24− (CSC) vs. CD24+ (NCSC) MDA-MB-468 cells. Shown are mean ± SD (n=3). (B) Immunofluorescent images of patient breast cancer tissues showing CD44+ cells with CPT1B elevated expression. (C) ATP luminescence assay showing differential ATP production in etomoxir-treated CSC MDA-MB-468, BBM2 and BBM3 tumorspheres compared to NCSC MDA-MB-468, BBM2 and BBM3 adherent cells. Shown are mean ± SD (n=3). (D) Cell proliferation of CSC and NCSC MDA-MB-468 cells after etomoxir treatments at the indicated concentrations. Shown are mean ± SD (n=3). (E) Limiting dilution assay demonstrating etomoxir impact on tumorsphere formation of BBM2 tumor cells (1 in 5.14 to 1 in 20.2 cells, p=9.26×10⁻⁹ with Χ2, n=18). (F) Flow cytometric analysis of the proportion of CD44high/Sca-1high cells in tumors harvested from MMTV-PyMT mice treated with PBS or 5mg/kg perhexiline. Shown are mean ± SD (n=4). (G) Real time PCR showing gene expression of SOX2 and ALDH1A1 in tumors harvested from MMTV-PyMT treated with PBS or 5 mg/kg perhexiline. Shown are mean ± SD (n=4).*p<0.05, **p<0.005, and ***p<0.0005

