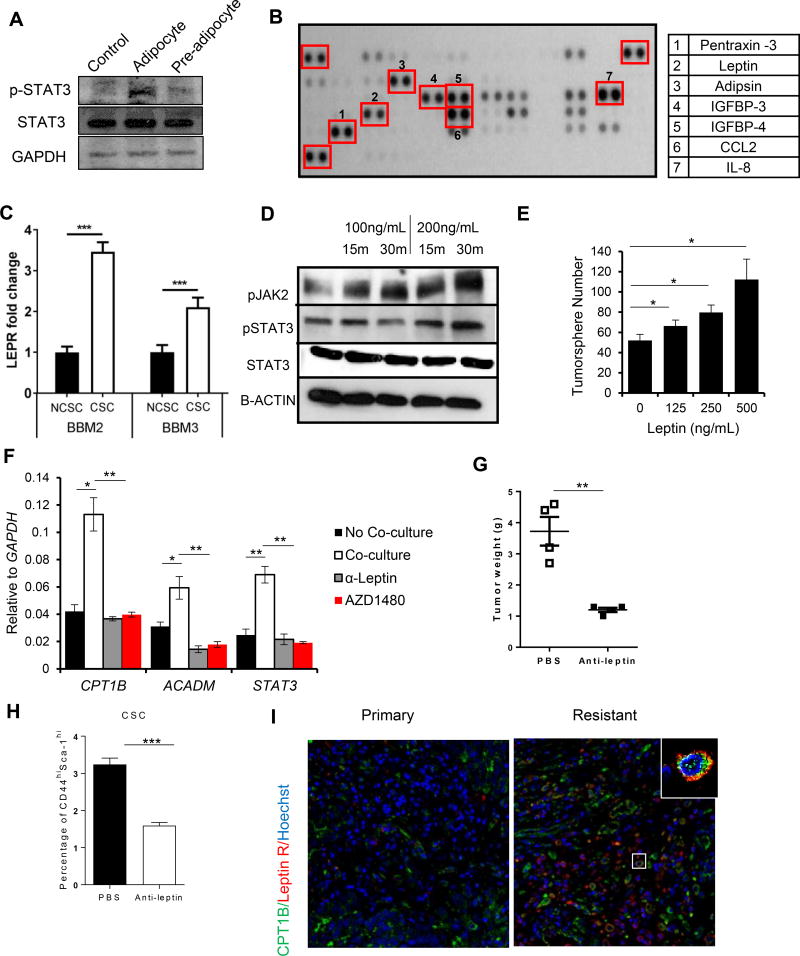
Figure 5. Adipocyte-Derived Leptin Activates STAT3-CPT1B to Drive FAO in BCSCs.
(A) Western blot showing increased phosphorylation of STAT3 at Y705 (pSTAT3) in BBM2 tumorspheres after co-culture with human breast adipocytes or pre-adipocyte. BBM2 culture alone was used as control. (B) Adipokine array identifying adipokines in supernatant from human breast adipocytes. Right, table listing the most highly secreted adipokines. (C) Real-time PCR measuring LEPR mRNA levels in BBM2 and BBM3 tumorspheres (CSC) vs. adherent cells (NCSC). LEPR expression of CSC was then normalized with NCSC. Shown are mean ± SD (n=3). (D) Western blot showing increases in phosphorylation of JAK2 (pJAK2) and STAT3 (pSTAT3) in BBM2 tumorspheres upon leptin stimulation with the indicated conditions. (E) Tumorsphere formation of BBM2 cells treated with leptin at the indicated concentrations. Shown are mean ± SD (n=3). (F) Real-time PCR comparing expression of CPT1B and ACADM in BBM2 tumorspheres cultured with or without human breast adipocytes, treated with leptin neutralizing antibody (α-Leptin) or 1µM AZD1480. Shown are mean ± SD (n=3). (G) Tumor weights of tumors collected from multiple sites in MMTV-PyMT mice treated with PBS or α-Leptin (250 µg/kg). Shown are mean ± SD (n=4). (H) Flow cytometric analyses of single-cell suspensions prepared from tumors collected from MMTV-PyMT mice treated with PBS or α-Leptin (250 µg/kg). Shown are mean ± SD (n=4). (I) Expression of Leptin receptor and CPT1B in primary and resistant TNBC tumors. FFPE tissue sections from TNBC patients were stained by immunofluorescence for Leptin receptor (red) and CPT1B (green); nuclei were counterstained with Hoechst (blue).*p<0.05, **p<0.005, and ***p<0.0005.

