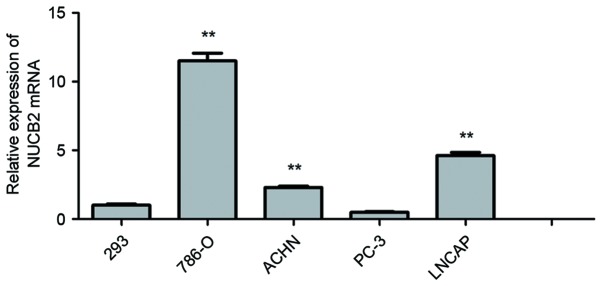
Figure 1.
Polymerase chain reaction analysis of NUCB2 in various urological tumor cells. There was a significant increased expression of NUCB2 in 786-O (11.50±0.57; P<0.01), ACHN (2.30±0.10; P<0.01) and LNCaP cells (4.62±1.08; P<0.01) compared with the HEK-293 cells. The y-axis indicates the relative levels of mRNA (2−ΔΔCq). Data are presented as the mean ± standard error. **P<0.01. NUCB2, nucleobindin 2.

