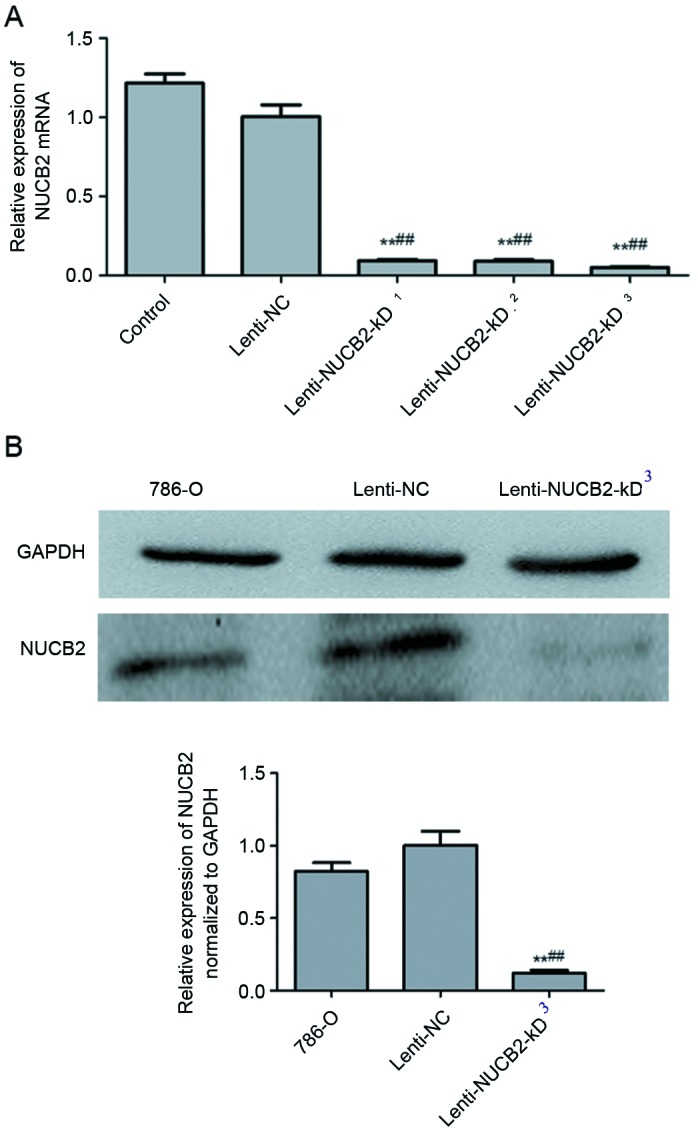
Figure 2.

NUCB2 expression in NUCB2-knocked down cells. (A) There was a significant decreased expression of NUCB2 in lenti-NUCB2-KD cells compared with the negative control in the 3 different knockdown groups (0.094±0.08, 0.092±0.11 and 0.051±0.004 vs. 1.01±0.075; lenti-NUCB2-KD1, lenti-NUCB2-KD2 and lenti-NUCB2-KD3 vs. the lenti-NC, respectively; all P<0.01). The y-axis indicates the relative mRNA levels (2−ΔΔCq). (B) Western blotting analysis of NUCB2 expression. The y-axis indicates the relative expression of NUCB2 normalized to GAPDH. Data are presented as the mean ± standard error. The control was the 786-O cell line. **P<0.01 vs. control cells; ##P<0.01 vs. lenti-NC group. NUCB2, nucleobindin 2; NC, negative control.
