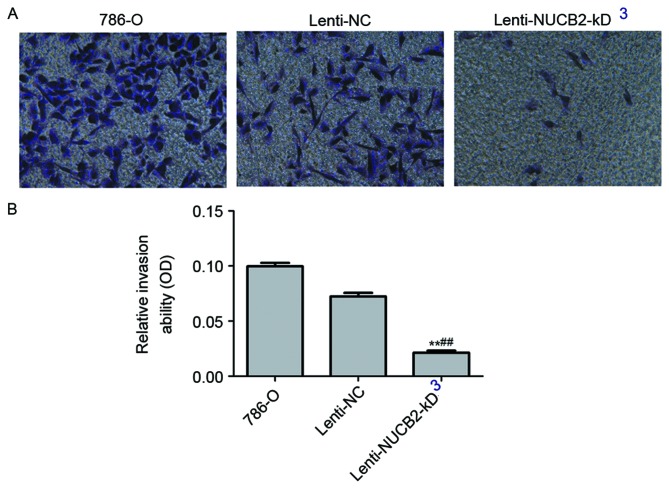
Figure 4.
NUCB2 promotes invasion of 786-O cells. (A) Flow cytometric analysis of tumor cell invasion (magnification, ×100). (B) The relative invasion rate was significantly decreased in the lenti-NUCB2-KD cells compared with the negative control group (0.02±0.002 vs. 0.07±0.003; P<0.01). The y-axis indicates the relative invasion ability. Data are presented as the mean ± standard error. **P<0.01 vs. control; ##P<0.01 vs. lenti-NC group. NUCB2, nucleobindin 2; OD, optical density; NC, negative control.

