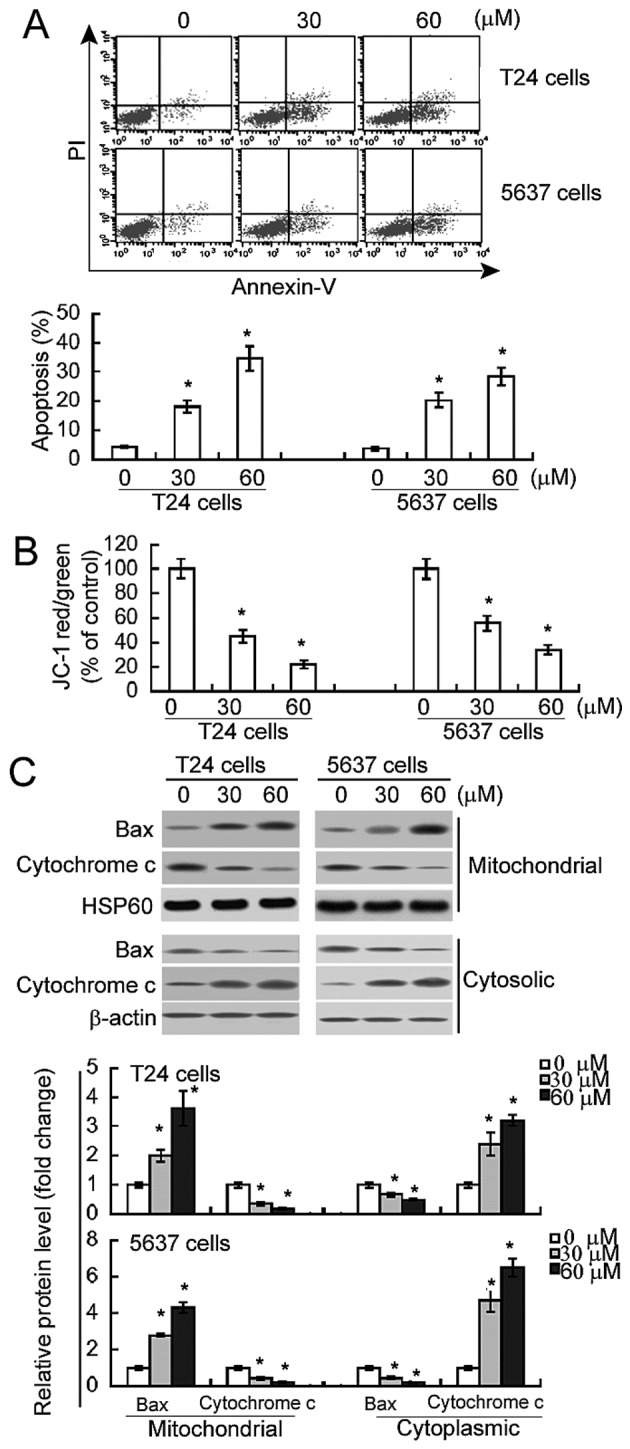
Figure 3.

Genipin induces apoptosis of bladder cancer cells via the mitochondrial apoptotic cascade. (A) Flow cytometry analysis of apoptosis of bladder cancer cells with or without genipin treatment for 48 h following staining with Annexin V and PI. Representative dot plots of apoptosis are presented in top panels. Bar graphs represent quantification of apoptosis from three independent experiments. (B) Measurement of Δψm was performed by flow cytometry using JC-1 staining. Results are expressed as percentage of control values (assigned 100%). (C) Western blot analysis of indicated proteins following genipin treatment (30 or 60 µM) for 48 h. Bar graphs indicate densitometric analysis of western blots from three independent experiments. *P<0.05 vs. vehicle-treated cells. PI, propidium iodide; HSP60, heat shock protein 60; Bax, B-cell-2-like protein 4.
