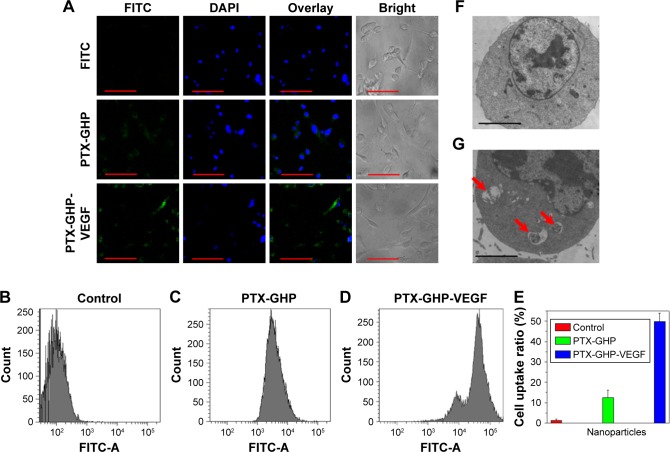
Figure 7.
Celluar uptake.
Notes: (A) Confocal fluorescence images of SW-13 cells after incubation with free FITC, GHP-VEGF, and PTX-GHP-VEGF labeled by FITC. Green and blue colors represented FITC fluorescence and DAPI-stained cell nuclei, respectively. (B–E) Flow cytometry analysis and quantitative cellular uptake of SW-13 cells toward control, GHP-VEGF, and PTX-GHP-VEGF. (F, G) Bio-TEM images of SW-13 cells after incubation with PBS and PTX-GHP-VEGF for 3 hours. Red arrows indicated the presence of PTX-GHP-VEGF. Scale bar represents 20 µm (A), and 2 µm (F, G).
Abbreviations: PTX, paclitaxel; VEGF, vascular endothelial growth factor; PBS, phosphate-buffered saline; FITC, fluorescein isothiocyanate; TEM, transmission electron microscopy; DAPI, 6-diamidino-2-phenylindole; GHP, GO-HSA-PEG.

