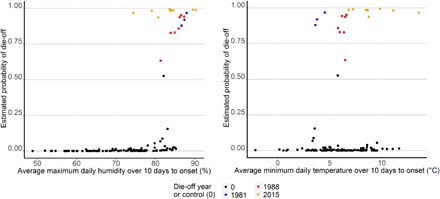
Fig. 4. Probability of die-off related to selected environmental variables in the 10 day period to onset, 1979 to 2015.

(A) Fitted values for the probability of a die-off event against mean maximum daily relative humidity in the previous 10 days, with the three die-off years in different colors. (B) Fitted values for the probability of a die-off event against mean minimum daily temperature in the previous 10 days, with the three MME years in different colors.
