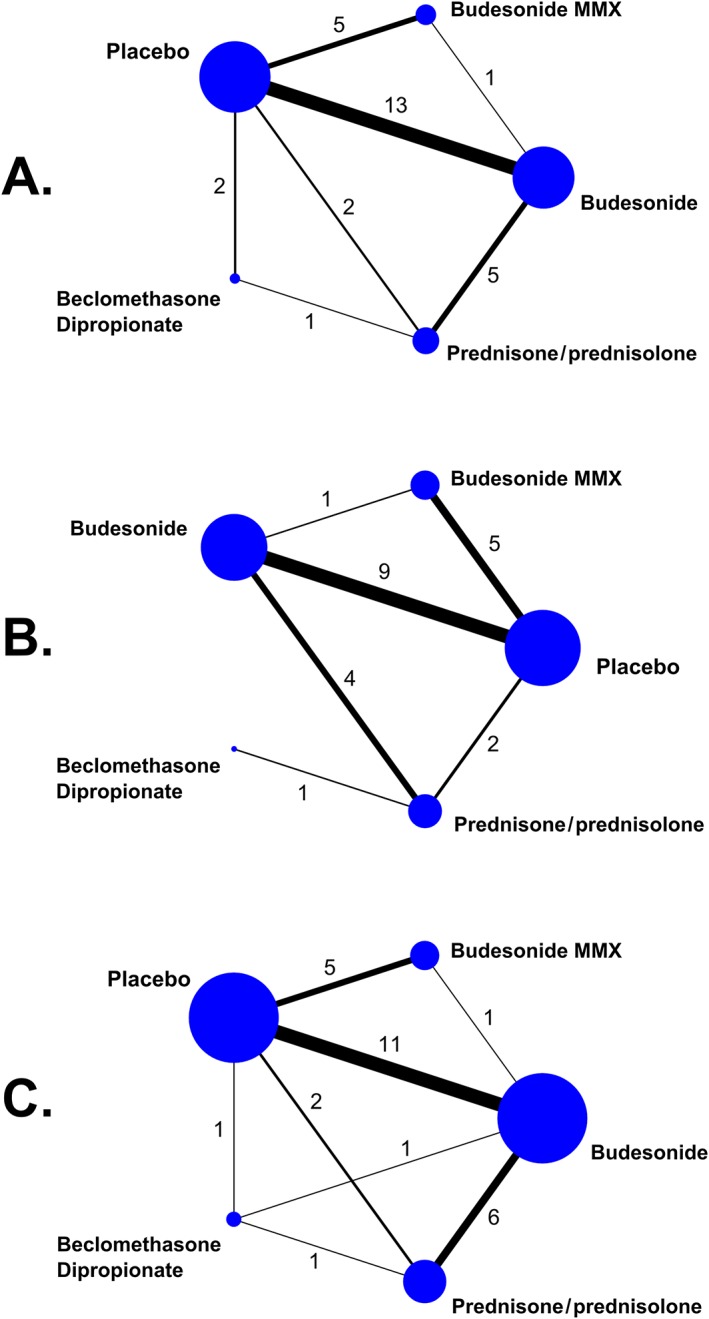
Figure 3.

Network geometry. The nodes represent the individual drugs; lines represent direct comparisons using clinical trials; thickness of lines represents the number of available clinical trials, also represented by the numbers. (A) Treatment discontinuation or withdrawal from the study due to adverse events. (B) Serious adverse events. (C) Corticosteroid‐related adverse events
