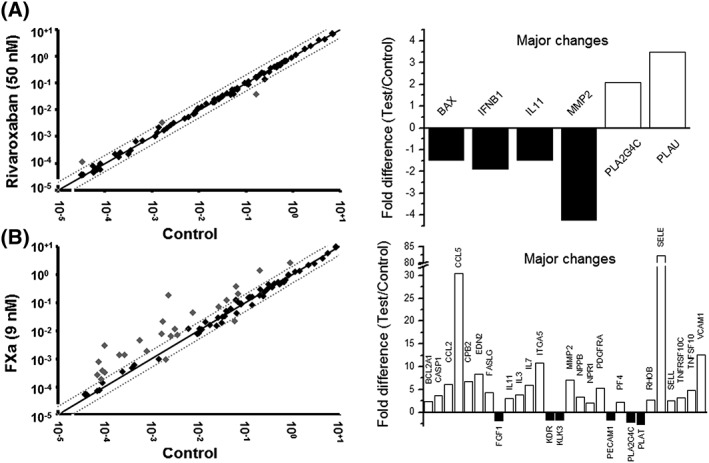
Figure 1.

Profiled PCR array. Effects of rivaroxaban (A) or FXa (B) on the transcriptome of selected genes. HUVEC were incubated for 4 h with rivaroxaban, FXa or vehicle (control). Signal intensities of treated vs. control are plotted on left‐hand side, dashed lines and grey points indicate >twofold changes compared with controls. On the right‐hand side, transcripts showing major fold differences are represented in columns: black for downregulations and white for upregulations. Three different samples were analysed for each treatment. Official symbol of the genes as provided by HUGO Gene Nomenclature Committee (HGNC)
