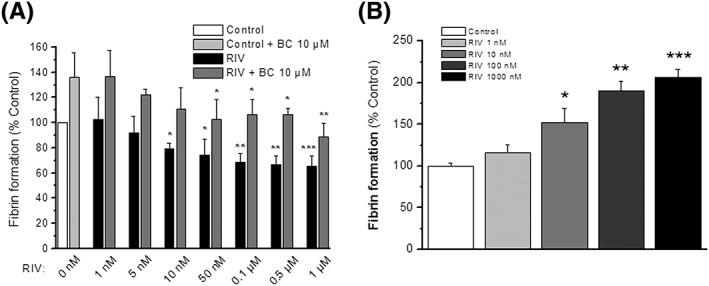
Figure 6.

Fibrin formation and fibrinolysis. Percentages of fibrin formation in cell‐based experiments (A) after 4 h of treatment with (black columns) or without (white column) rivaroxaban at the concentrations indicated are shown. In a series of experiments BC‐11‐hydroxibromide (10 μM) was added after the treatment during the time of fibrin formation both to control (light grey column) and to treated cells (grey columns). In a series of experiments thrombin‐induced fibrin formation in the absence of cells was measured (B) in the presence of rivaroxaban (1–1000 nM). Columns represent mean values of the percentage of response ± SEM in vertical bars, referred to control experiments. Results are from at least four independent experiments by sextuplicate. *P < 0.05, **P < 0.01 and ***P < 0.001 with respect to their control experiments. Abbreviations as in Figure 4
