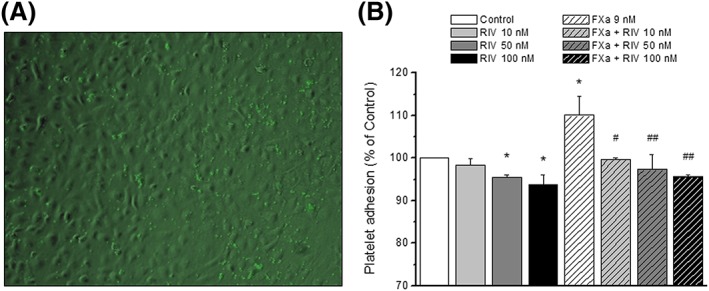
Figure 7.

Platelet adhesion to treated HUVEC monolayers. HUVEC were treated during 4 h with rivaroxaban (RIV; 10–100 nM), FXa (9 nM) or their combinations and compared with control (no treatment). (A) Representative merged image of platelet stained with calcein‐AM over a transmitted image of a HUVEC monolayer. (B) mean percentage of response with respect to control (columns) ± SEM (vertical bars) of a minimum of three independent experiments. *P < 0.05 with respect to control; #P < 0.05 and ##P < 0.01 with respect to FXa
