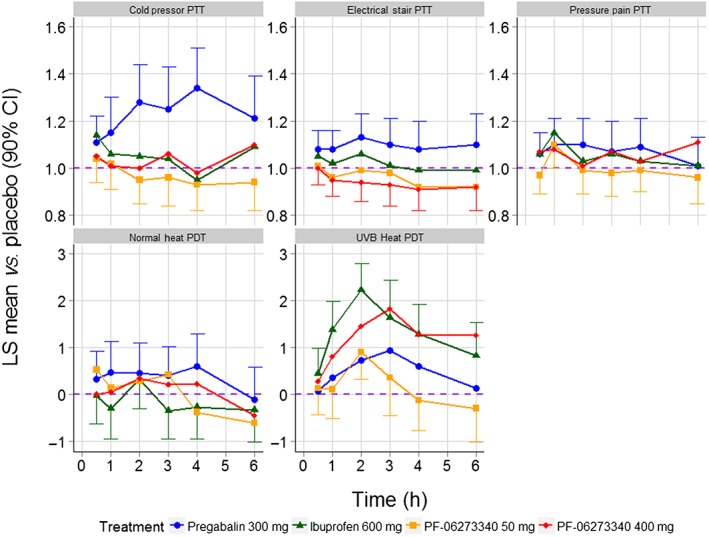
Figure 3.

Time course of treatment effects across the five primary endpoints. The purple horizontal dashed line represents no effect over placebo. PTT endpoints are presented on the fold‐change to placebo scale, whereas PDT endpoints are presented on the absolute difference to placebo scale. CI, confidence interval; LS mean, least squares mean; PDT, pain detection threshold; PTT, pain tolerance threshold; UVB, ultraviolet B
