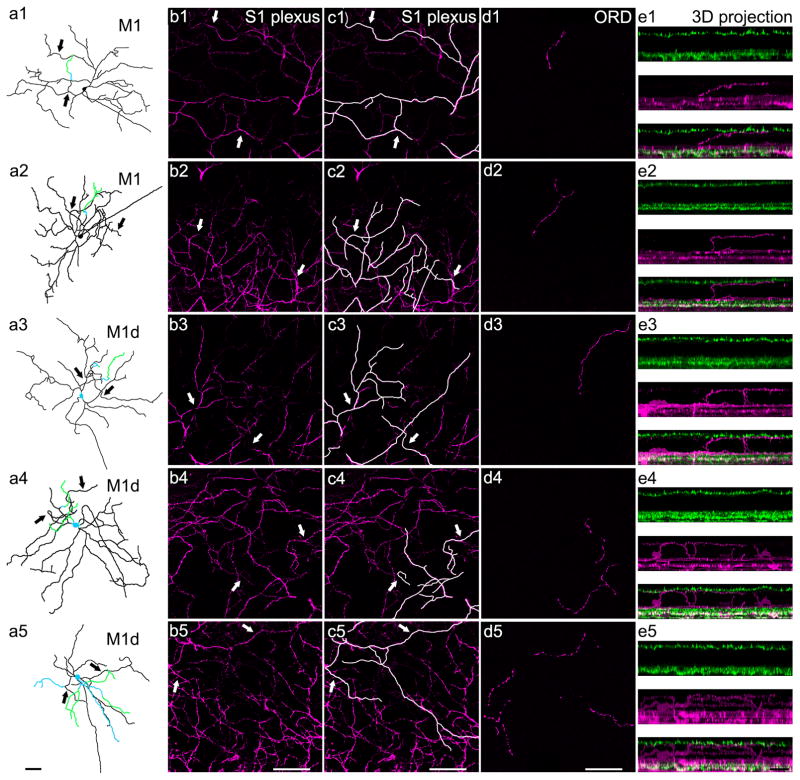
Figure 2. ORDs in the OPL originate from a subset of biplexiform M1 and M1d melanopsin ganglion cells and exhibit five general dendritic morphologies.
a1–a5) Whole cell reconstructions of biplexiform melanopsin ganglion cells with each type of ORD morphology at P12. Images are depth-coded so that black represents dendrites or somas in the GCL and IPL, blue represents dendrites or somas in the INL, and green represents dendrites that stratify in the OPL. Both M1 and M1d cells are known to have dendrites that stratify in the S1 plexus, so arrows indicate dendrites that can be seen in both the whole cell tracings and the confocal images of the S1 plexus to the right. From top to bottom: M1 with an unbranched ORD, M1 with a branched ORD, M1d with an unbranched ORD, M1d with a branched ORD, and M1d with an ORD in the OPL as well as an ORD in the INL. b1–b5) Confocal optical sections (0.50 μm) of the melanopsin-immunopositive S1 plexus (magenta). Arrows indicate dendrites in the S1 plexus that can also be seen in the respective whole cell tracings in the first column. c1–c5) Confocal optical sections (0.50 μm) of the melanopsin-immunopositive S1 plexus (magenta). Dendrites that are present in both the whole cell tracing and the S1 plexus have been highlighted for clarity. Arrows indicate dendrites in the S1 plexus that can also be seen in their respective whole cell tracings in the first column. d1–d5) A single optical section (0.50 μm) generated from a series of confocal images masked to correct for the imperfect flatness of the retina. Immunopositive melanopsin ORDs stratifying in the OPL (magenta). e1–e5) 3D projections of confocal z-stacks (magenta=melanopsin, green=VGLUT1) to show the 21 biplexiform nature of a subset of M1 and M1d melanopsin ganglion cells. a1–d5 scale bars: 50 μm; e1–e5 scale bar: 25 μm.

