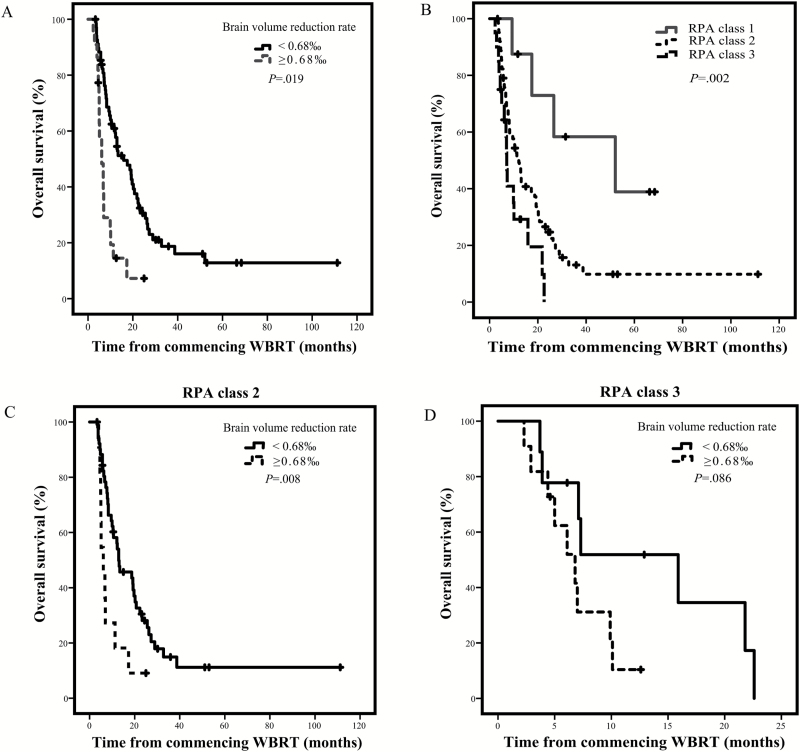
Fig. 3.
Kaplan–Meier curves depicting survival. (A) Univariate effect of the extent of BVRR on overall survival. (B) Overall survival in patients of each RPA class. (C) Univariate effect of the extent of BVRR on overall survival for RPA class 2 patients. (D) Univariate effect of the extent of BVRR on overall survival for RPA class 3 patients.

