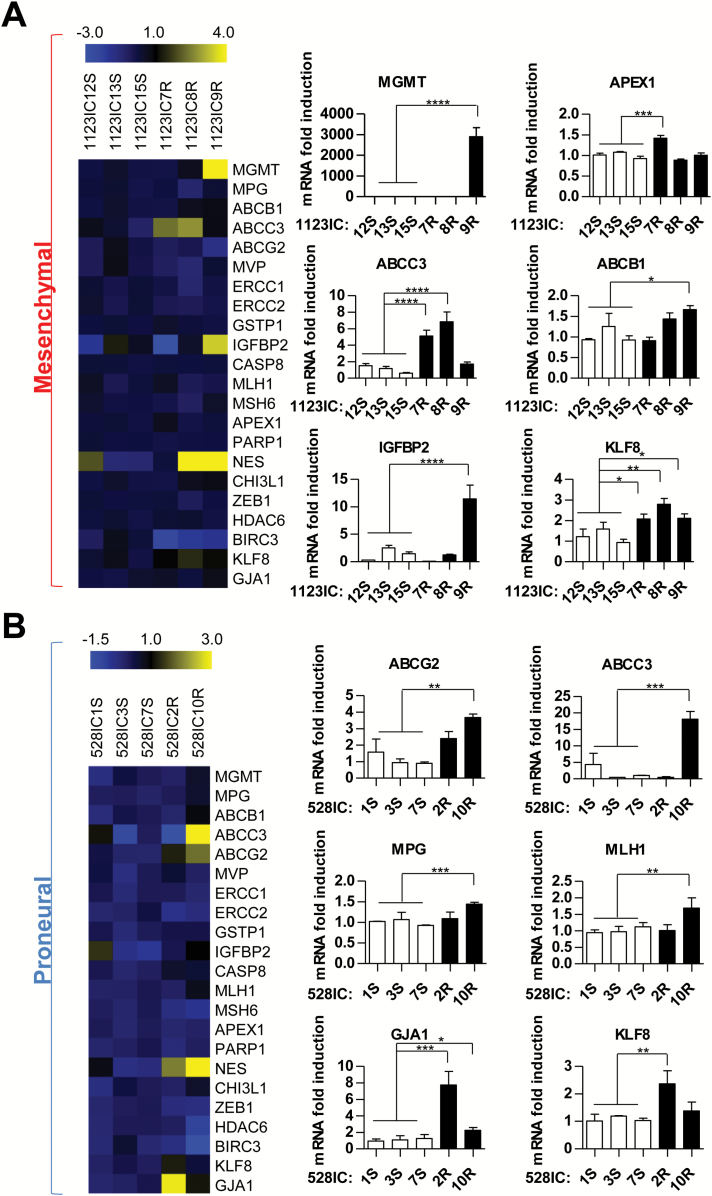
Fig. 4 .
Heterogeneous expression of genes associated with TMZ resistance among secondary GSCs isolated from individual mice following chemotherapy in vivo. Profiles of mRNA among clonally related SGSCs isolated from PN (528) or MES (1123) brain tumors: control (S), TMZ resistant (R) (as in Fig. 2). Markers for which differences were significant are shown as bar graphs (right panel), in MES (A) and PN (B) cell lines (1 = average mRNA expression in TMZ-sensitive cell lines). The heatmap (left panel) represents the global profile of all markers of resistance tested. ****P < 0.0001; ***P < 0.001; **P < 0.01; *P < 0.05 (N = 3).

