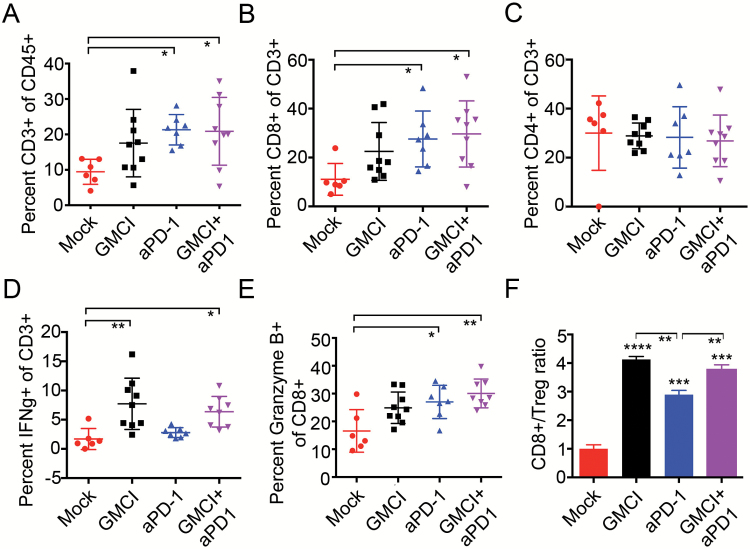
Fig. 5.
Immune cell infiltrates following GMCI, PD-1 blockade, and combination therapy. GL261Luc2 tumors were established and treated as described in Fig. 4. Tumor-infiltrating lymphocyte populations were prepared from brains on day 21. (A) CD3+ as a percentage of live CD45+ cells. (B) CD8+ effector T cells as a percentage of live CD45+CD3+ cells. (C) CD4+ T cells as a percentage of live CD45+CD3+ cells. (D) IFN-γ+ as a percentage of live CD45+CD3+ cells. (E) Quantification of CD8+/Granzyme B+ effector T cells as a percentage of live CD45+CD3+CD8+ cells. (F) Ratio of effector CD8+ T cells to Tregs. Long horizontal bars indicate the mean values. Shorter horizontal bars indicate the standard deviation. One-way ANOVA was used to determine statistical significance (***P ≤ 0.001, **P ≤ 0.01).

