
Fig. 5. Priming with Fasudil improves chemotherapy at secondary sites and decreases metastatic burden.
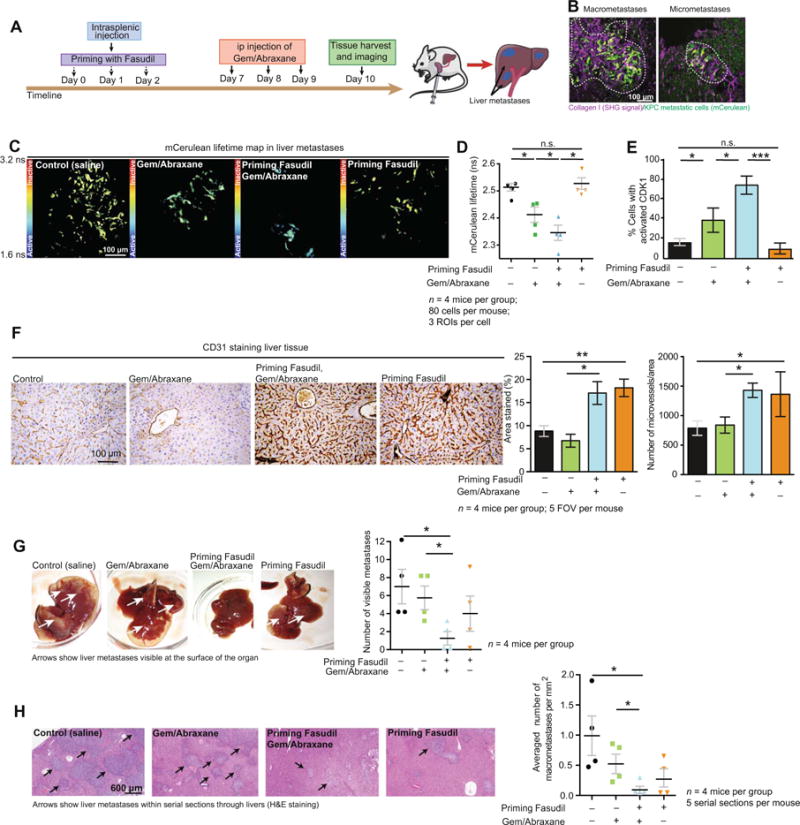
(A) Schematic representation of intrasplenic injection of KPC cells and treatment timeline. (B) Representative pictures of macrometastases (diameter, >200 μm) and micrometastases (diameter, <200 μm) identified via live imaging in liver metastases at the experimental end point. White dashed lines delimitate macrometastases and micrometastases. (C) Representative mCerulean lifetime maps in liver metastases. (D) Quantification of mCerulean lifetime. (E) CDK1 activity in metastatic KPC cells upon treatment with control (saline);Gem/Abraxane alone; Fasudil, then Gem/Abraxane;and Fasudil alone. n = 4 mice per group, 80 cells per mouse, three ROIs per cell. (F) CD31 staining and quantification of area positively stained and microvessel density in liver tissue upon treatment with control (saline);Gem/Abraxane alone;Fasudil, then Gem/Abraxane;and Fasudil alone. n = 4 mice per group and five FOVs per mouse. (G) Pathological examination of liver metastases and quantification of visible metastases on the surface of the tissue. White arrows point at KPC metastases visible at the surface of the organ. (H) Quantification of liver macrometastases normalized to liver surface area in hematoxylin and eosin (H&E) serial sections. Black arrows point at macrometastases in the liver tissue. Results are means ± SEM. n = 4 mice per group and five serial sections per organ (100-mm step). P values were determined by nonparametric ANOVA test with Holm-Sidak correction for multiple comparisons.