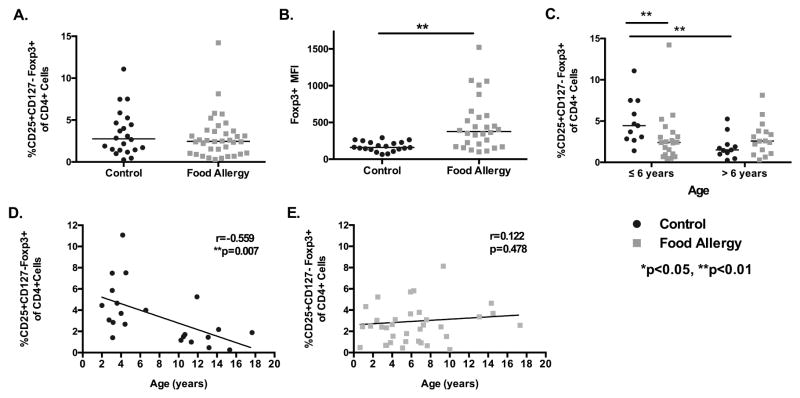
Figure 1. Comparison of the percentage of CD25+CD127loFoxp3 Tcells in peripheral blood mononuclear cells from children with and without food allergy.
A. Comparison of CD25+CD127loFoxp3+ CD4+ T cells populations between control and food allergic children. B. Mean fluorescence intensity (MFI) of Foxp3 in CD25+CD127loFoxp3+ cells between food allergic and control children. C. CD25+CD127loFoxp3+ T-cell percentage in young children (<6 years) and older children (7–17 years). D and E. Linear correlation of age and CD25+CD127loFoxp3+ percentage in control and food allergic children. **p=0.007 for control children. *p<0.05, **p<0.01, Mann-Whitney U test. Black bars represent the median. MFI: Mean Fluorescence Intensity.

