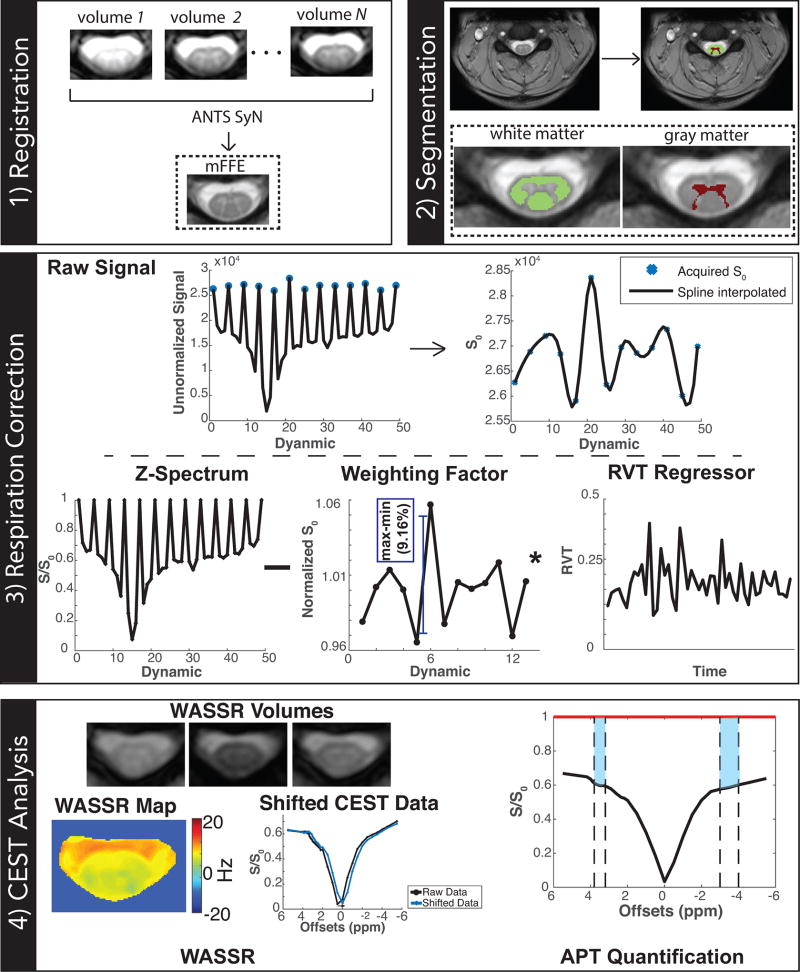
Figure 1. Image Processing Pipeline.
The CEST data is registered to the anatomical, which is segmented into white and gray matter. The respiration volume per unit time (RVT) is regressed out of the CEST data, scaled by a weighting factor calculated from the 13 interspersed S0 images. The resulting z-spectrum is shifted using WASSR.

