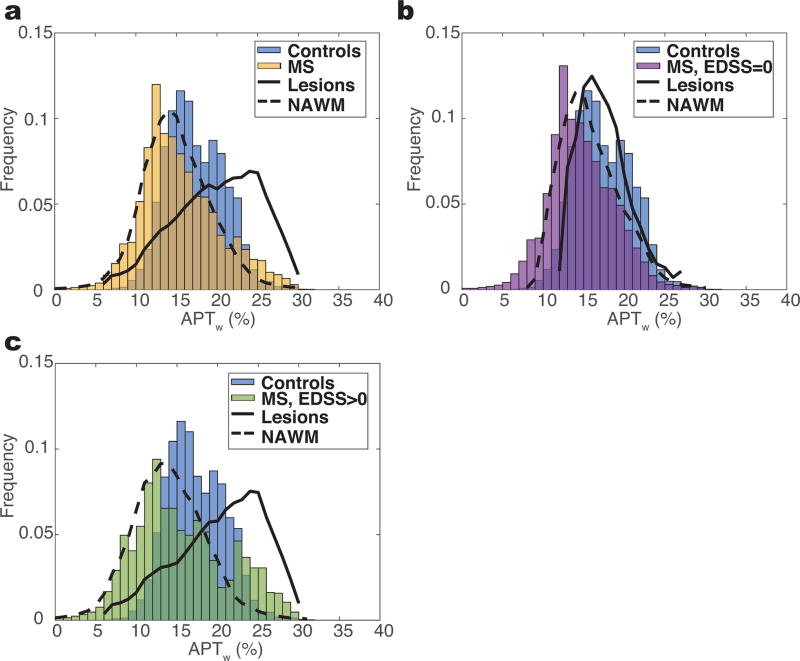
Figure 4. Histogram Analysis of APTw Measurement.
a) Histogram of white matter voxels over all MS patients (yellow) overlaid onto histogram of all controls (blue). b) Large overlap is observed between the controls and MS patients with EDSS of 0 (n=5). c) Patients with an EDSS greater than 0 (green) show a larger deviation from the control histogram and follow a more bimodal distribution, which can be explained by the distributions of distinct types of white matter (lesions vs. NAWM).

