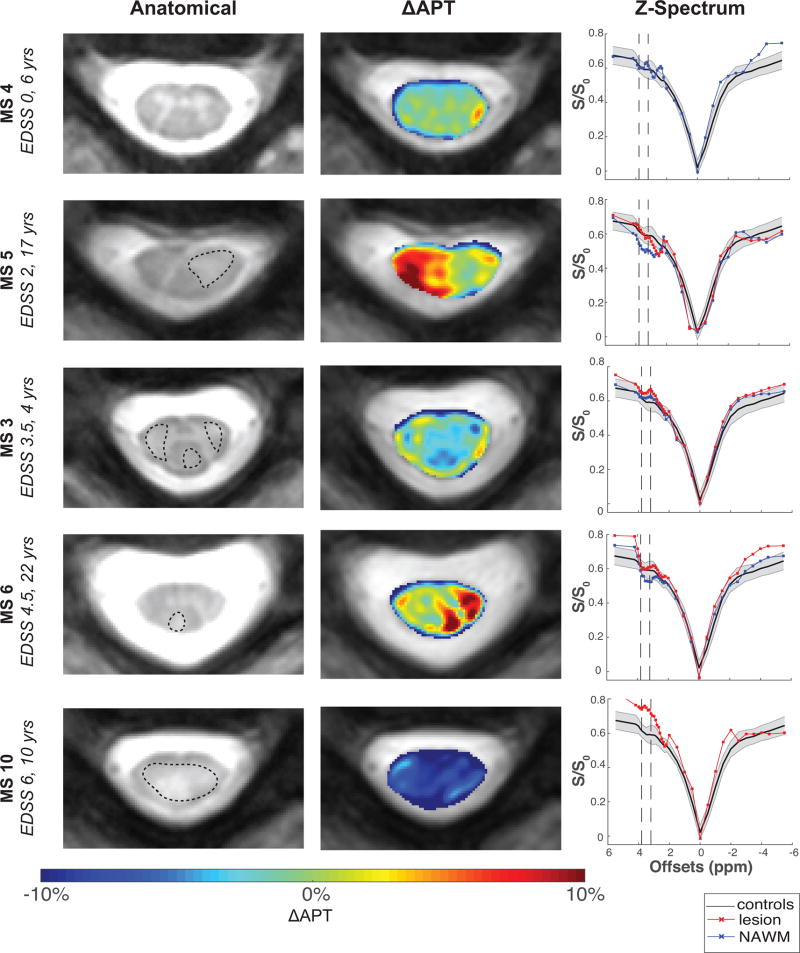
Figure 5. Spatial Characterization of APT in MS Patients.
Spinal cord changes in MS patients with varying disease intensity, with anatomical imaging in left column, APT difference maps (ΔAPT) with respect to mean controls in middle column, and corresponding z-spectrum on the right. ΔAPT changes in the NAWM are observed throughout all patients, along with significant heterogeneity between patients.

