Figure 2.

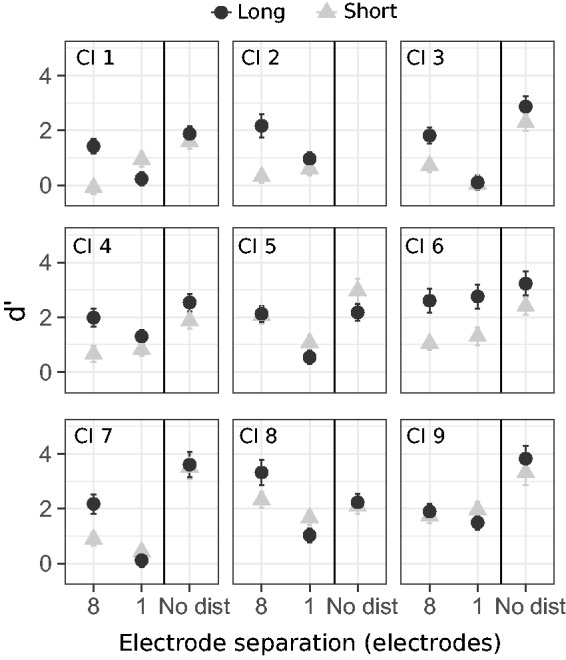
Individual sensitivity to the delayed tone (d′) for each electrode separation and sequence duration. Error bars represent the standard errors of the d′ estimates.

Individual sensitivity to the delayed tone (d′) for each electrode separation and sequence duration. Error bars represent the standard errors of the d′ estimates.