
FIGURE 5.
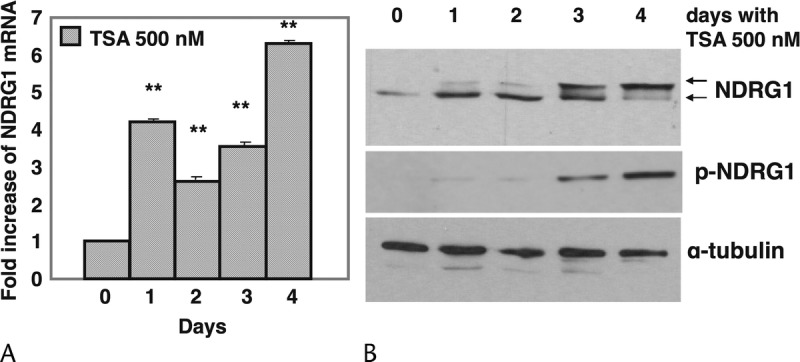
Regulation of NDRG1 expression by histone acetylation. PANC-1 cells were treated with TSA and monitored for 4 days in normal culture conditions (21% O2). A, RNA was isolated and real-time PCR performed. Ct values for NDRG1 were normalized against the internal ribosomal RNA (18S) control probe to calculate ΔCt values. Columns: means of three values; bars, SD. The results shown are from one representative experiment out of three independently performed experiments. **P < 0.01 compared to control. B, Expression of NDRG1 protein by western blotting. The same membrane used for CA II protein expression (Fig. 3A) was probed with a sheep anti-phospho-NDRG1 (>43 kDa) antibody. To determine total NDRG1, the membrane was stripped and reprobed with a sheep anti-NDRG1 (43 kDa) antibody.