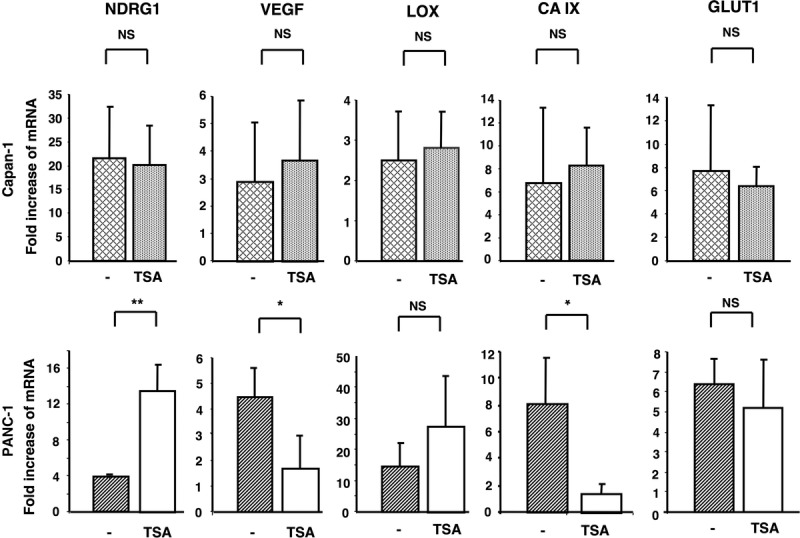
FIGURE 7.

Impact of TSA-induced differentiation on Capan-1 (well-differentiated) cells (upper row) and PANC-1 (poorly-differentiated) cells (lower row) in response to hypoxia. The 2 cell lines were untreated or treated for 3 days with TSA and exposed to hypoxia (1.5% O2) for the last 24 hours of treatment. Ct values for each hypoxia-inducible gene were normalized against the internal ribosomal RNA (18S) control probe to calculate ΔCt values and compared with untreated cells cultured under normoxic conditions. Columns: means of three values of three separate experiments; bars, SD. *P < 0.05, **P < 0.01.
