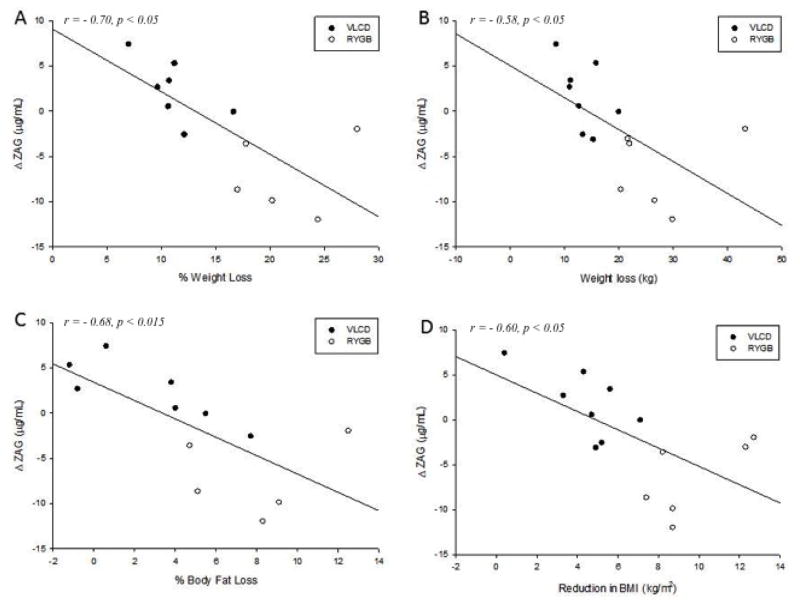
Figure 1.
Scatter plots and regression lines for the change in (A) plasma ZAG concentrations and (B) % weight loss, (C) % body fat loss, and (D) reduction in BMI in subjects who underwent RYGB or VLCD.
Across groups, change in plasma ZAG concentrations was inversely correlated with % weight loss (r= −0.70, p<0.05), amount of weight loss (r= −0.58, p<0.05), % body fat loss (r= −0.68, p<0.015), and reduction in BMI (r= −0.60, p<0.05). Note that above a certain threshold of weight loss, ZAG begins to decrease for those in the VLCD group.

