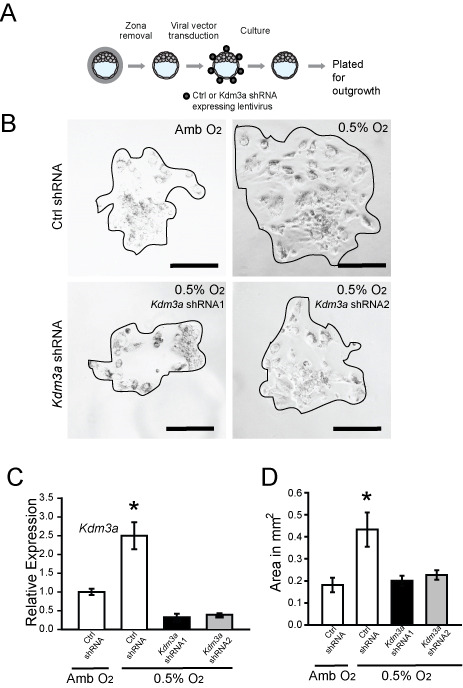
Figure 2. Effects of oxygen tension and KDM3A expression on blastocyst outgrowth.

A. Schematic showing experimental plan for lentiviral transduction of blastocysts and outgrowth assay. Blastocysts were transduced with control (Ctrl) or Kdm3a shRNA and cultured for 72 h to allow hatching from the zona pellucida. The attached blastocysts were exposed to ambient (Amb) or low oxygen (0.5% O2) for 24 h and analyzed. B. Representative images of blastocyst outgrowths from Ctrl shRNA and exposed to Amb, Ctrl shRNA and exposed to 0.5% O2, and Kdm3a shRNAs and exposed to 0.5% O2. C. Measurement of Kdm3a transcripts in control and knockdown cultures was measured by qRT-PCR. Asterisks indicate significant differences among groups (n = 6/group; *P < 0.05). D. The bar graph shows quantification of outgrowth area in square millimeters. The area of the outgrowth was measured using ImageJ software (Ctrl shRNA + Amb, n = 6; Ctrl shRNA + 0.5% O2, Kdm3a shRNA1 + 0.5% O2, n = 10; Kdm3a shRNA2 + 0.5% O2, n = 10; *P < 0.05). Data presented in C and D were analyzed with ANOVA and Student-Newman-Keuls test. This figure appeared in Chakraborty et al. (2016) .
