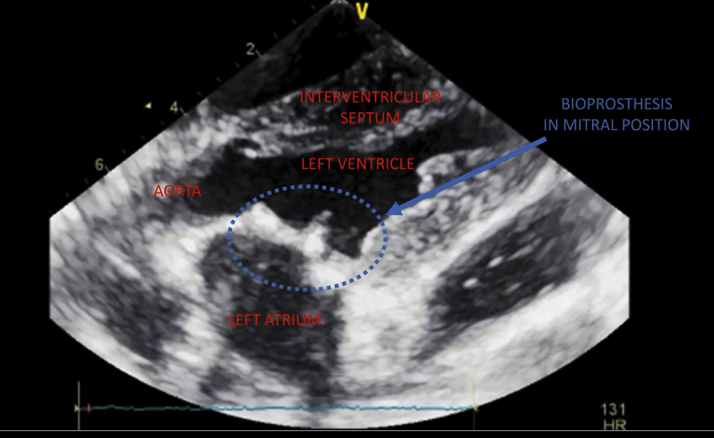
Figure 4.
Images of Echocardiography During Procedure
During PCU a “cavitation bubble cloud” is visible as a hyperechogenic zone (red arrow). After PCU, the improvement of the bioprosthesis opening is confirmed thanks to the echocardiography (green arrow). The images are realized during diastasis (closed aortic valve). See Supplemental Video 1. Ao = aorta; other abbreviations as in Figure 2.
In vivo procedure of pulsed cavitational ultrasound therapy


